A live event dashboard is one web page that shows your key event numbers as they change: registrations, payments, marketing and check-in. With Claude and the Eventtia MCP server, you can build one from your real event data in a few minutes, with one prompt and no code, then share it with your team.
Event managers make dozens of decisions every day. Is registration on track? How many attendees are in the venue right now? Which session needs more staff? Too often, they answer these questions with numbers from yesterday. Or without the right numbers at all.
The problem is not a lack of data. Your event software records every registration, payment and check-in. The problem is getting all that data in one place, live, for the whole team. In a 2026 survey of 162 meeting and event professionals by Global DMC Partners, only 30% said they use data or analytics tools to track the return on their events. Yet 68% said their stakeholders push them to prove the business impact of their events (Global DMC Partners Industry Pulse Survey, 2026).
This guide shows you how to build an event dashboard with Claude, step by step, with Eventtia as the event platform. Prefer video? Watch the full tutorial below.
Summary: how to build a live event dashboard with Claude in 6 steps
| Step | What you do | What you get |
|---|---|---|
| 1. Connect Claude to Eventtia | Add the Eventtia connector in Claude and sign in | Claude can read your event data |
| 2. Open Artifacts, then Dashboard | Start a new dashboard in Claude | An empty dashboard ready to build |
| 3. Pick the model and effort | We used Opus 5.5 with medium effort | A good balance of quality and speed |
| 4. Write your prompt | Data source, rules, visual identity, key numbers, tabs | A dashboard built for your event |
| 5. Review the dashboard | Check the numbers and ask for changes | A dashboard you trust |
| 6. Share it with your team | Share it with people in your Claude organization | One live view for the whole team |
What is a live event dashboard?
A live event dashboard is one web page that shows your key event numbers as they change: registrations, payments, marketing channels and check-ins. It pulls the data straight from your event software. So everyone on the team sees the same numbers, at any time, on a laptop or a smartphone.
A dashboard is not the same as a report. A report answers questions once, after the event. A dashboard answers them every hour, while you can still act. A typical event management dashboard shows:
- Registrations: total, per attendee type, and per week compared with your goal.
- Payments: money collected and money still pending.
- Marketing: which channels bring the most registrations.
- Check-in: how many attendees are in the venue now, per session, and compared with last year.
Eventtia already has live dashboards inside the platform. What is new is that you can now design your own dashboard, shaped around the questions your team asks, without writing code.
Why has building a live event dashboard always been so hard?
Because event data lives in many different tools, and connecting them used to take technical skills, time and money. Here are the main reasons:
- The data is scattered. Registration, payments, check-in, marketing and the CRM often live in separate tools.
- Exports go stale. Each report means exporting files, pasting them into a spreadsheet and matching columns. By the time it is ready, the numbers are old.
- Building it needed experts. A custom dashboard needed a designer, a developer and several days of work. Business intelligence tools needed a data team.
- Managers depended on others. To get a number on event day, managers had to find the person with the laptop and the right file.
Event teams know data matters. In the same Global DMC Partners survey, 44% of respondents said they have no ROI tracking in place at all. Wanting the data and having it live, in one place, are two very different things.
Why does a live event dashboard matter on event day?
Because the most important decisions happen during the event, when there is no time to export a file. With live numbers, you can move staff, answer sponsors and exhibitors, and fix problems while the event is still running.
Here are a few questions a live dashboard answers in seconds:
- Is the check-in queue growing? Open one more lane before attendees get frustrated.
- Why is the exhibition area quiet? Maybe most attendees are in a session right now.
- Is attendance lower than last year at the same hour? Now you know, instead of guessing.
- Which session is half empty? Send a reminder or a push message to fill it.
One Eventtia customer explains it well. David Amstutz, show organizer at Expomedia, says that analyzing check-ins by activity and by hour showed his team anomalies they could never detect before. It let them decide on targeted promotions while the show was still running.
Why can you build a live event dashboard with Claude in minutes now?
Because of two recent changes. First, MCP lets Claude read data directly from your event software. Second, Claude can now build dashboards as interactive web pages, called artifacts. Together, you describe the dashboard you want, Claude builds it, and the data refreshes from the source.
What is MCP, in simple words?
MCP stands for Model Context Protocol. It is an open standard that lets an AI assistant like Claude connect to other software and use its data, with your permission. Think of it as a secure plug between Claude and your tools.
Eventtia launched its MCP server on August 1, 2026. It is listed in Claude’s connectors library, so connecting takes one click and your Eventtia login. Claude then gets the same access as your Eventtia account, nothing more. The Eventtia MCP server is included with every Eventtia plan. To learn what it can do, read Inside the Eventtia MCP server.
Can the data come from other tools too?
Yes. In our example the data comes from Eventtia. But the same method works with other tools that offer a connector for Claude, such as Google Analytics, Amplitude or your CRM. Check which of your tools have an MCP connector before you plan your dashboard.
What do you need before you start?
You need three things:
- A paid Claude plan: Pro, Max, Ultra, Team or Enterprise. Pro is enough to build a dashboard and use it yourself. The Dashboards template is in beta.
- The right Claude settings: artifacts need code execution and file creation turned on, in Settings, then Capabilities. On Team and Enterprise plans, this is in Organization settings, and an owner can turn connectors off for everyone. On Enterprise, an owner must also turn on Dashboards (Claude Help Center).
- An Eventtia account connected to Claude via MCP. It takes about a minute. See Step 1 below.
If you want to share the live dashboard with your team, plan for a Claude Team or Enterprise plan. We explain why in Step 6.
How do you build a live event dashboard with Claude, step by step?
You connect Claude to your event software, open a new dashboard in Claude, write one clear prompt, review the result and share it. Here is each step in detail.
For this guide, we used the Future World Forum, a sample B2B conference that we use for Eventtia demos. It runs for 2 days, on December 14 and 15, 2026, at the Manhattan Center in New York. It has speakers, sponsors, exhibitors, 3 attendee types, 4 workshops, paid tickets and QR code check-in.
Step 1: How do you connect Claude to Eventtia?
In Claude, open Settings, then Connectors. Search for Eventtia, click Connect and sign in with your Eventtia email and password. That is it. Nothing to install, no code to paste.
- Open Claude and go to Settings, then Connectors.
- Search the library for “Eventtia”.
- Click Connect and sign in with your Eventtia account.
- Test it: ask Claude “List my upcoming events.” If you see your events, you are connected.
Full setup steps for every AI assistant are on the Eventtia MCP server page. Prefer video? Watch this one-minute tutorial:
Step 2: Where do you create a dashboard in Claude?
In Claude, go to Artifacts, then click Dashboard. This opens a new dashboard where you type your prompt.
Step 3: Which Claude model should you use?
In our video, we used Claude Opus 5.5 with the medium effort level. It gave us a complete, well-designed dashboard in a few minutes. You can try other models and effort levels: higher effort takes longer, lower effort is faster.
Step 4: What should your dashboard prompt include?
A good dashboard prompt tells Claude 5 things: where the data comes from, the rules to follow, the design, the key numbers and the tabs you want.
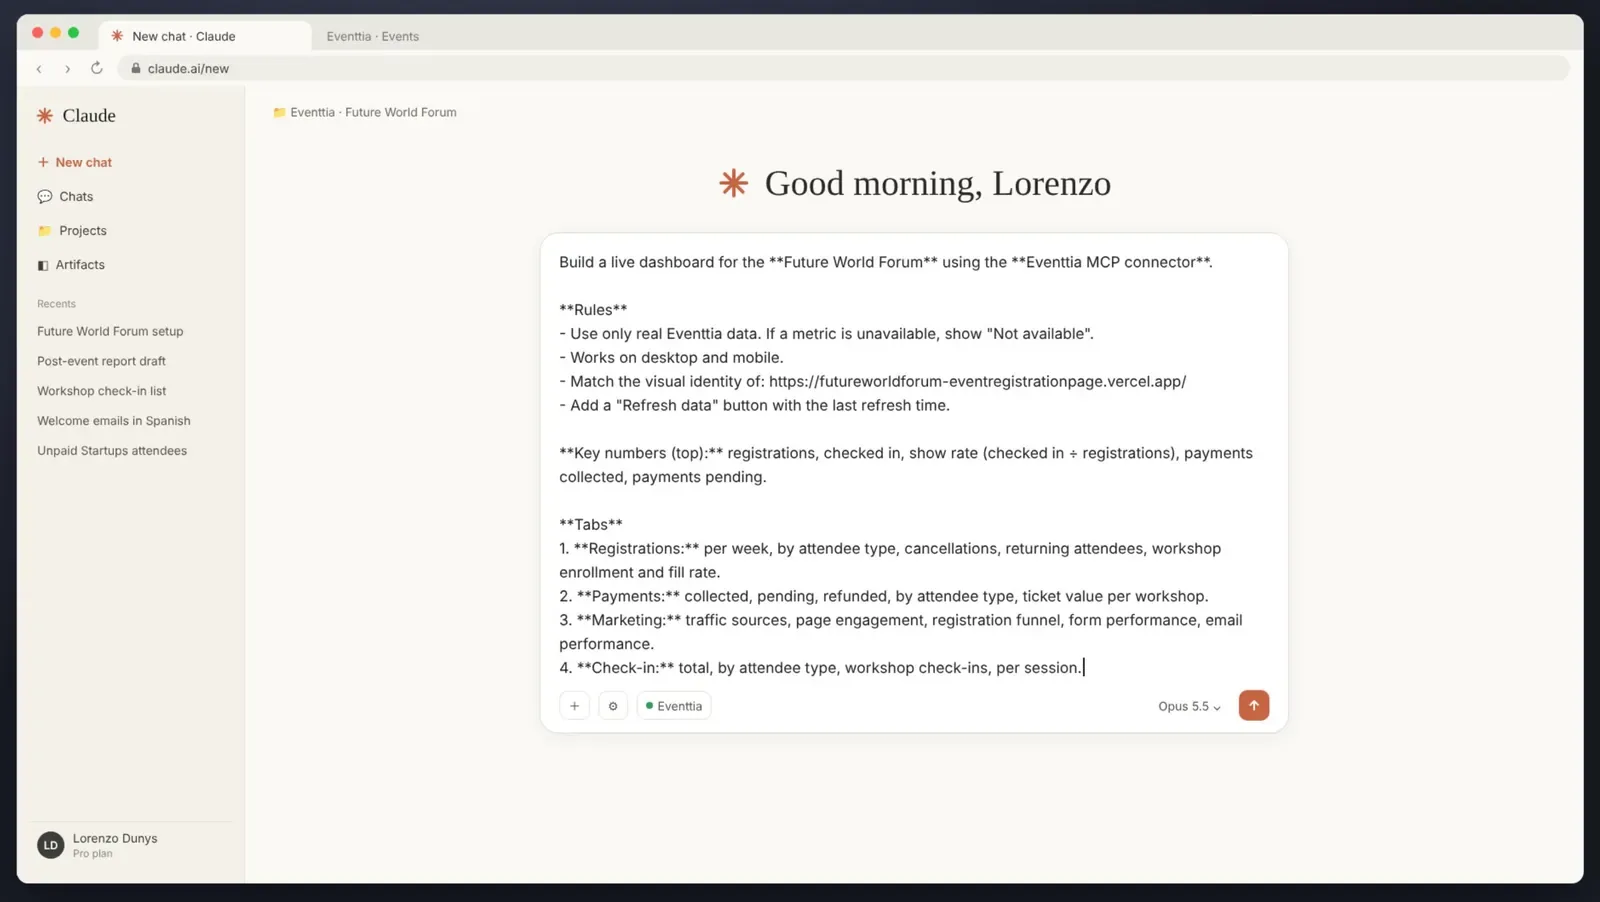
The prompt we used to build the live event dashboard with Claude
- The data source: name the event and the Eventtia MCP connector.
- The rules: use only real Eventtia data, and show “Not available” when a number is missing. This stops Claude from filling gaps with made-up numbers. Also ask for a page that works on desktop and mobile.
- The design: give the link to your registration page, so the dashboard uses the same colors and fonts.
- The key numbers: the 5 numbers you want at the top, with how to calculate them, like show rate = checked in ÷ registrations.
- The tabs: one tab per topic, and what each tab must show. Add a “Refresh data” button with the time of the last refresh.
Here is the prompt we used. Copy it and replace the event name and the registration page link with your own:
Build a live dashboard for the Future World Forum using the Eventtia MCP connector.
Rules
- Use only real Eventtia data. If a metric is unavailable, show “Not available”.
- Works on desktop and mobile.
- Match the visual identity of: [your registration page URL]
- Add a “Refresh data” button with the last refresh time.
Key numbers (top): registrations, checked in, show rate (checked in ÷ registrations), payments collected, payments pending.
Tabs
- Registrations: per week, by attendee type, cancellations, returning attendees, workshop enrollment and fill rate.
- Payments: collected, pending, refunded, by attendee type, ticket value per workshop.
- Marketing: traffic sources, page engagement, registration funnel, form performance, email performance.
- Check-in: total, by attendee type, workshop check-ins, per session.
Tips for a better dashboard prompt
- Name the event exactly as it appears in Eventtia.
- Say who will use the dashboard and on which device, for example “my team, mostly on smartphones”.
- Ask for one topic per tab. It keeps the dashboard simple to read.
- Start simple. You can ask Claude to add charts later.
Step 5: How do you check the dashboard Claude built?
Open the dashboard next to your registration page and in Eventtia. Check that the design matches and that the main numbers are the same as in the platform. If something is wrong or missing, ask Claude to change it in plain language.
In our test, Claude used the same colors, the same fonts and the same visual identity as the registration page. We did not configure anything by hand.
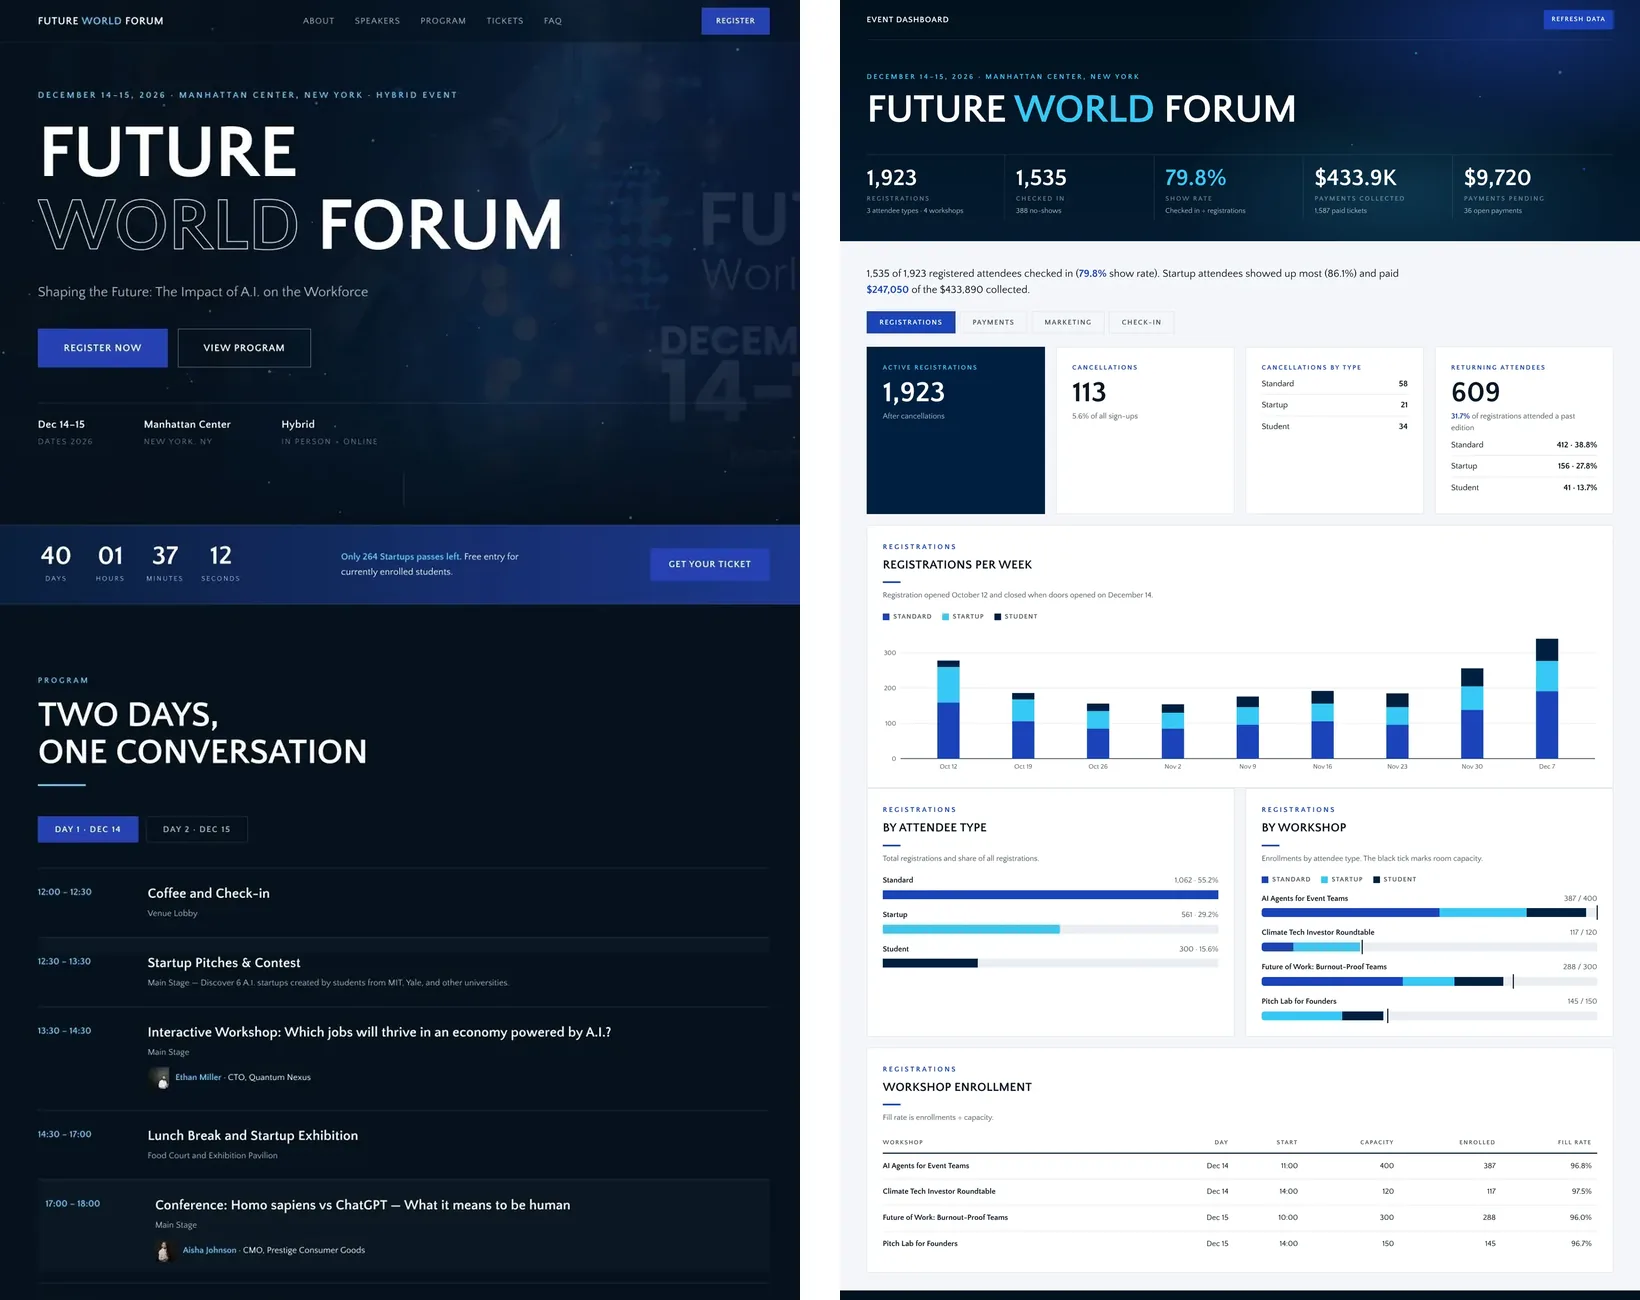
Left, the registration page. Right, the dashboard Claude built: same visual identity, nothing set by hand.
A few changes you can ask for:
- “Add a chart of registrations per week compared with our goal of 2,000.”
- “Make the Check-in tab easier to read on a smartphone.”
- “Show revenue per attendee type in the Payments tab.”
Step 6: How do you share the dashboard with your team?
Click Share and choose who can open it. A dashboard is only useful if your team can use it. Each person opens it with their own Claude account and their own Eventtia connection, so they only see the data their Eventtia role allows.
One rule to know. You can share a Claude dashboard by link or by email invitation, but the parts that use connected apps, like Eventtia, do not work for people outside your Claude organization. On Pro, Max and Ultra plans, that means anyone but you. So to share a live dashboard, share it inside your organization, which takes a Team or Enterprise plan. Each person signs in to Claude and uses their own connections (Claude Help Center).
What does the live event dashboard show?
At the top, the main numbers in one look. Below, 4 tabs, each answering one question you ask every day: Registrations, Payments, Marketing and Check-in.
Headline numbers
Registrations, check-ins, show rate, payments collected and payments pending. Five numbers that tell you where the event stands in one second. In our example: 1,923 registrations, 1,535 attendees checked in, a 79.8% show rate, $433,890 collected and $9,720 still pending.
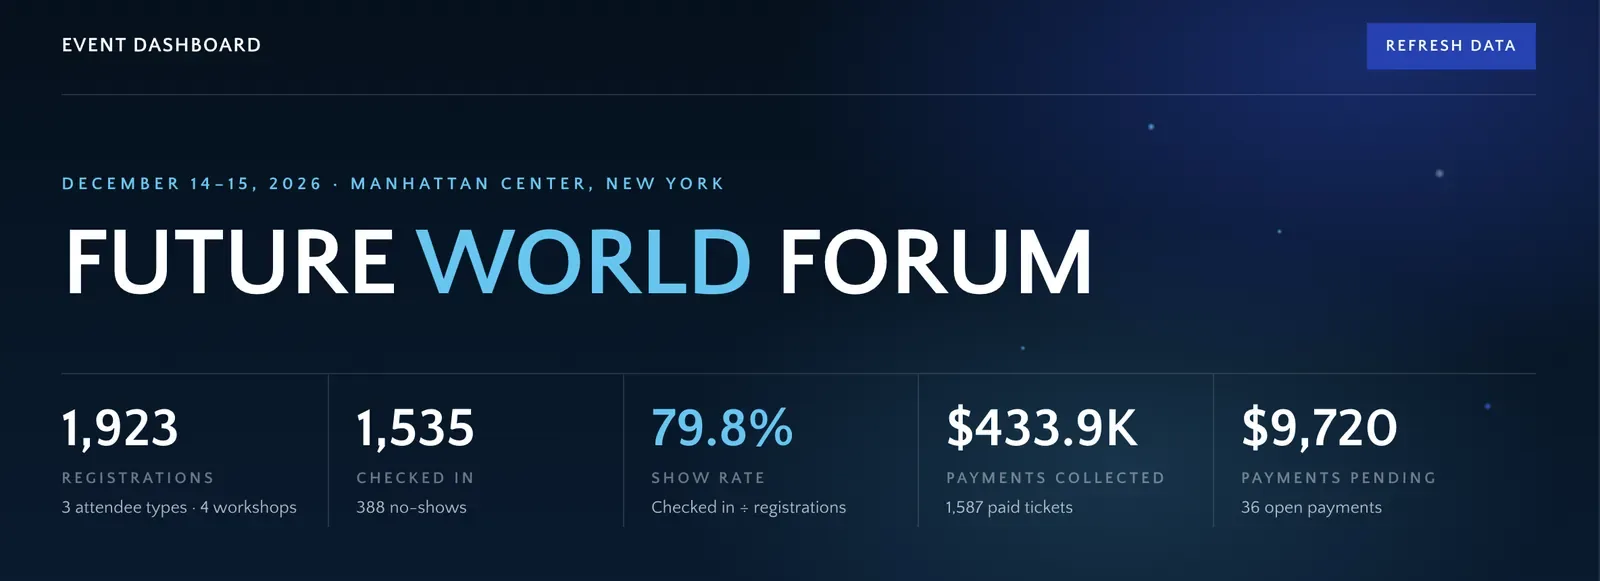
The main event numbers in one look, with the Refresh data button
Registrations tab: are we on track?
See registrations per week and per attendee type, cancellations, returning attendees and workshop fill rates. In our example, 609 attendees (31.7%) came to a past edition, and every workshop is at least 96% full.
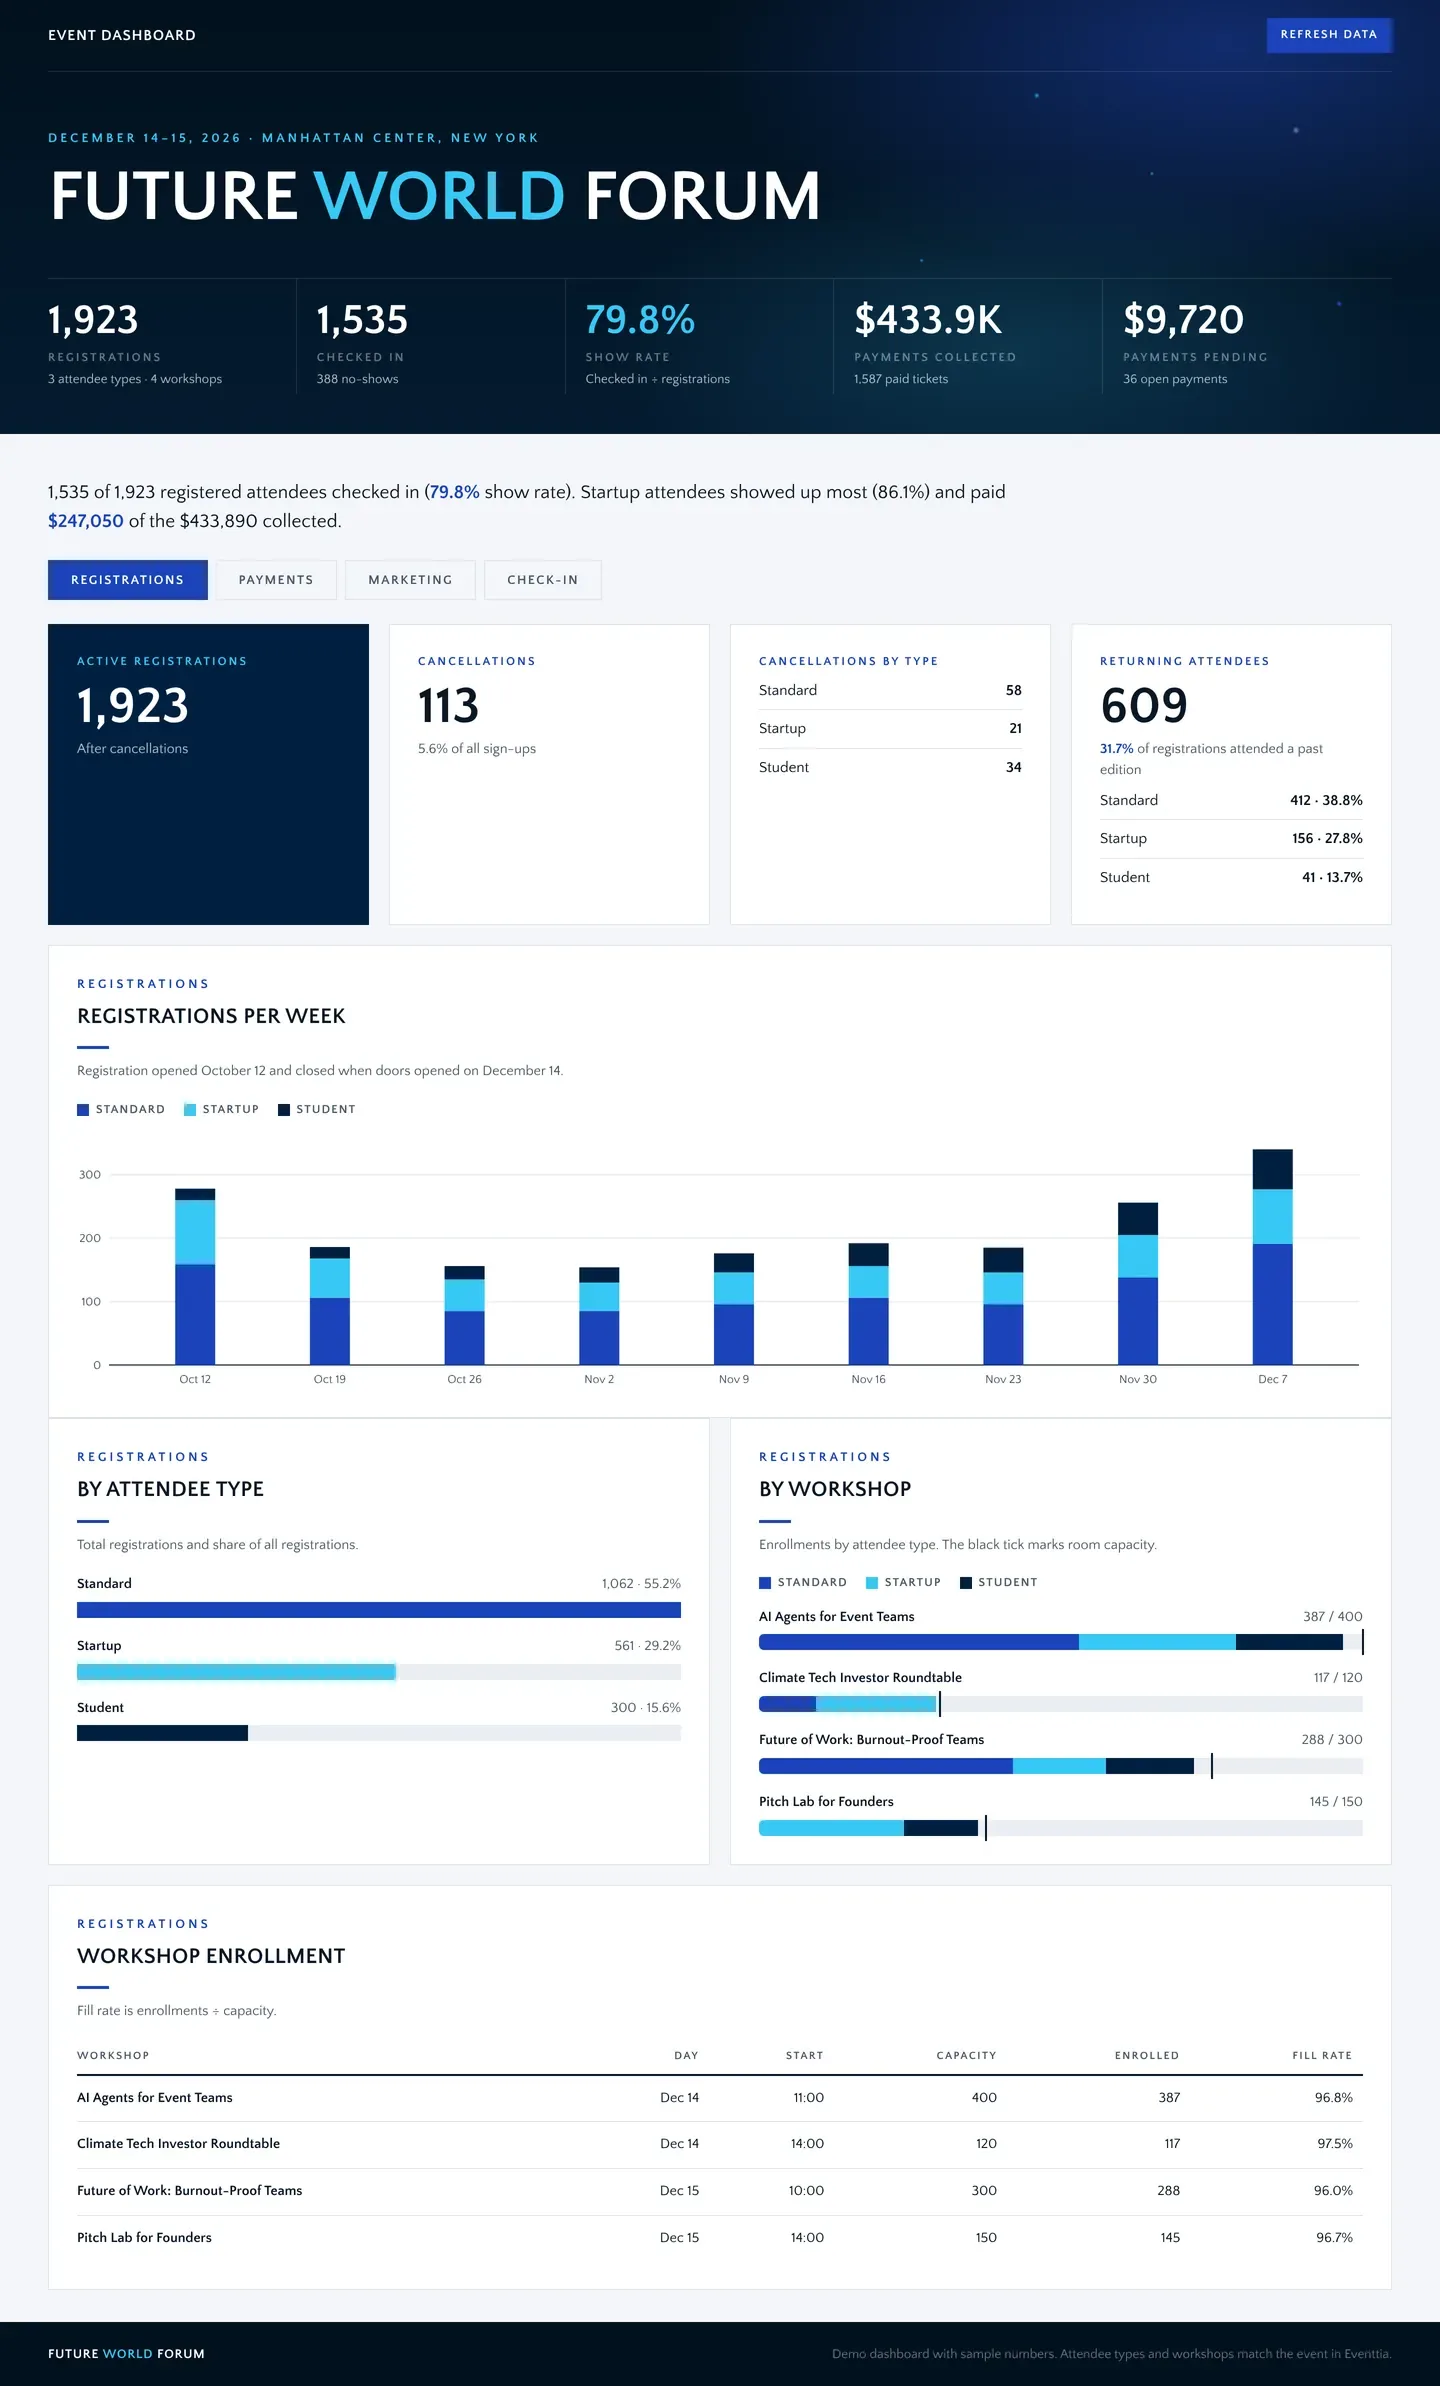
Registrations tab: are we on track?
Payments tab: how much money is still pending?
See the money collected, the money still pending and the refunds, per attendee type. You know who to follow up with before the event. In our example, 36 payments are still open, for a total of $9,720.
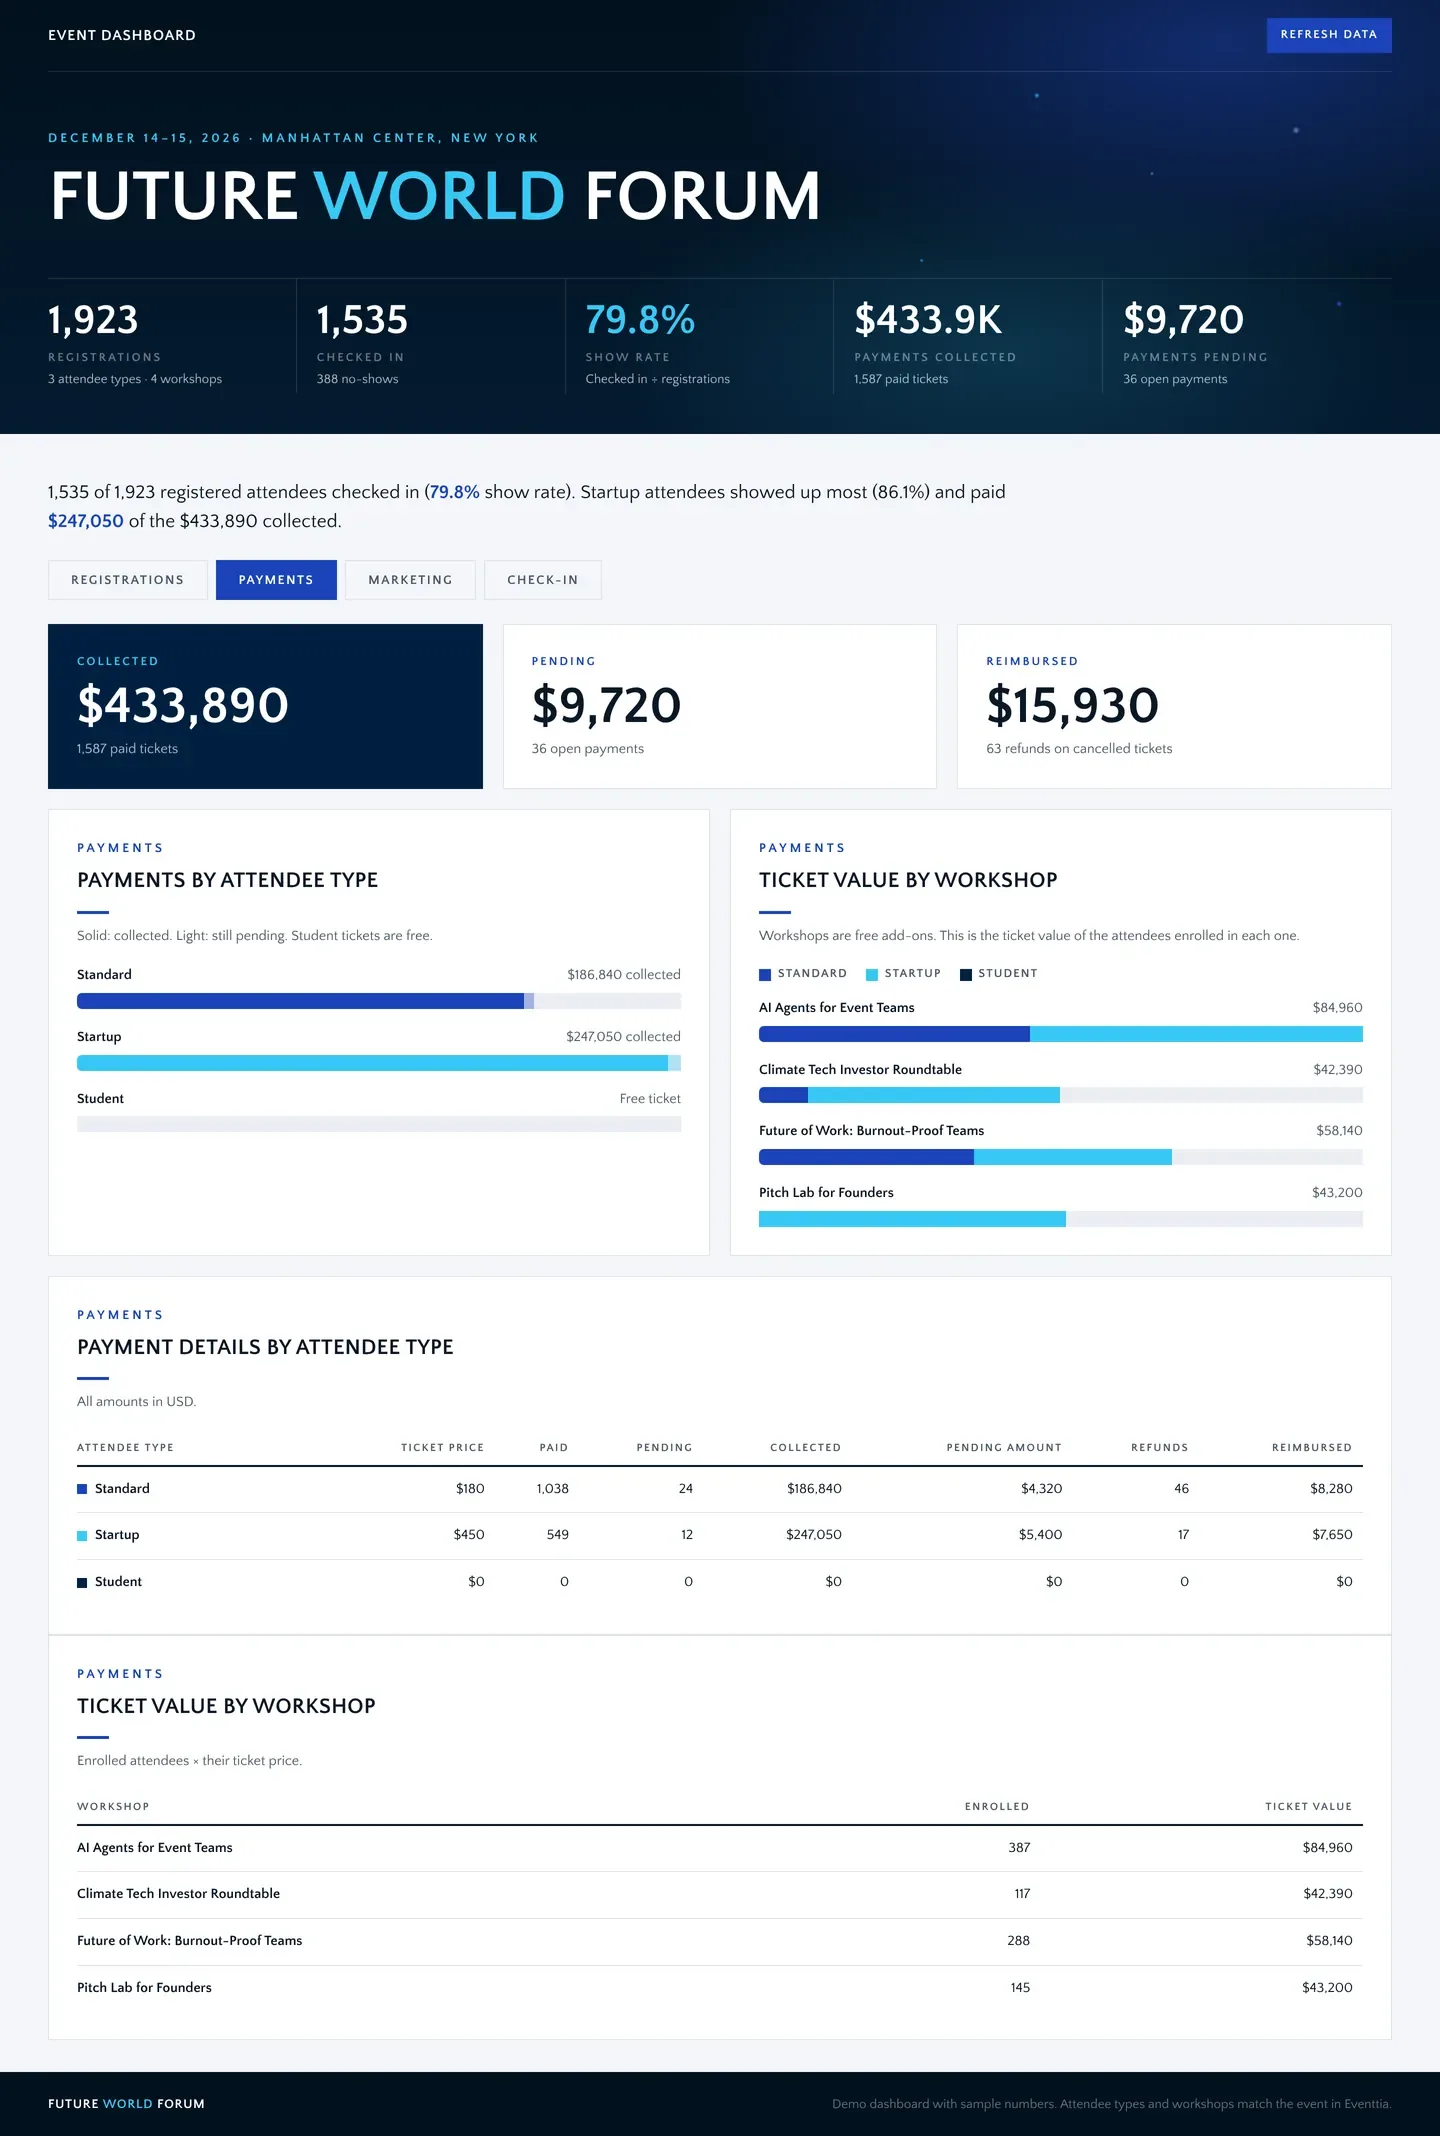
Payments tab: how much money is still pending?
Marketing tab: which channel brings the most registrations?
Compare traffic sources, the registration funnel, form performance and email performance. Put your budget and your time where it works. In our sample, the biggest drop happens before the form: only 28% of event page visitors click Register.
Traffic and email numbers depend on the tools you connect to Claude. The Eventtia MCP server does not share them, so for web traffic, for example, connect your web analytics tool next to Eventtia.
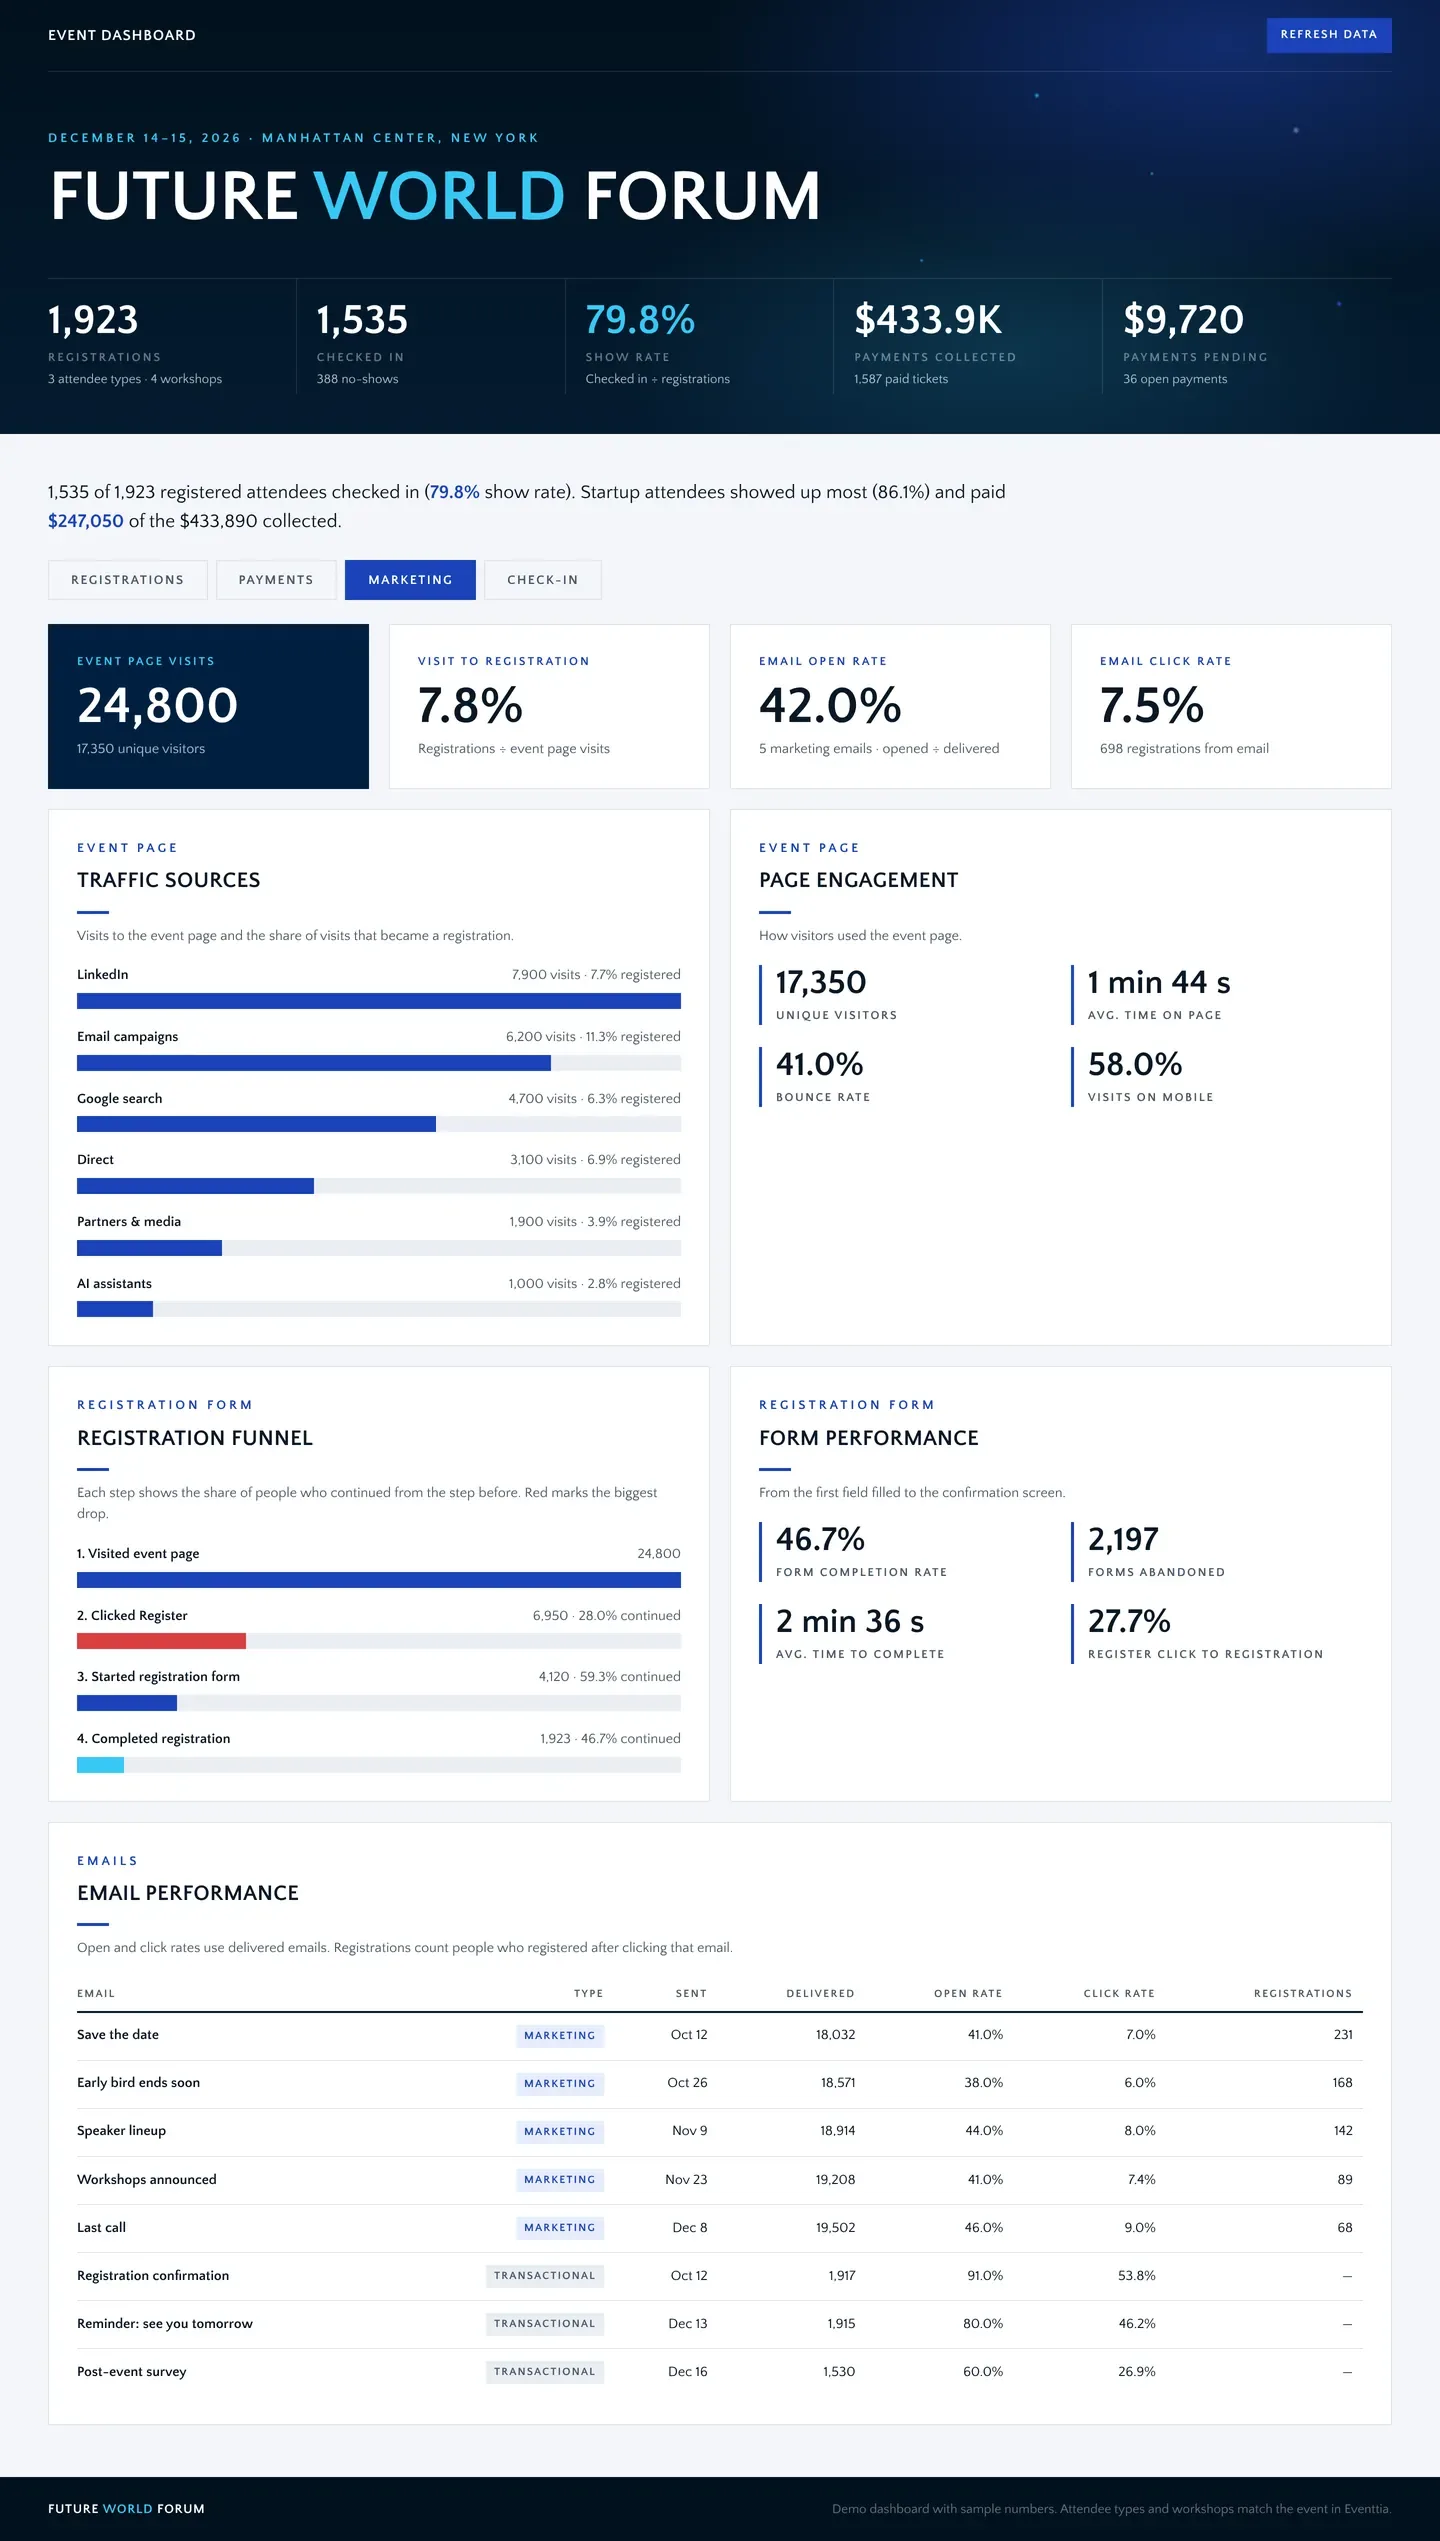
Marketing tab: which channel brings the most registrations?
Check-in tab: how many attendees are here right now?
See how many attendees have checked in, compared with the same hour at the last edition, per attendee type and session by session. Check-in data comes from the Eventtia check-in app.
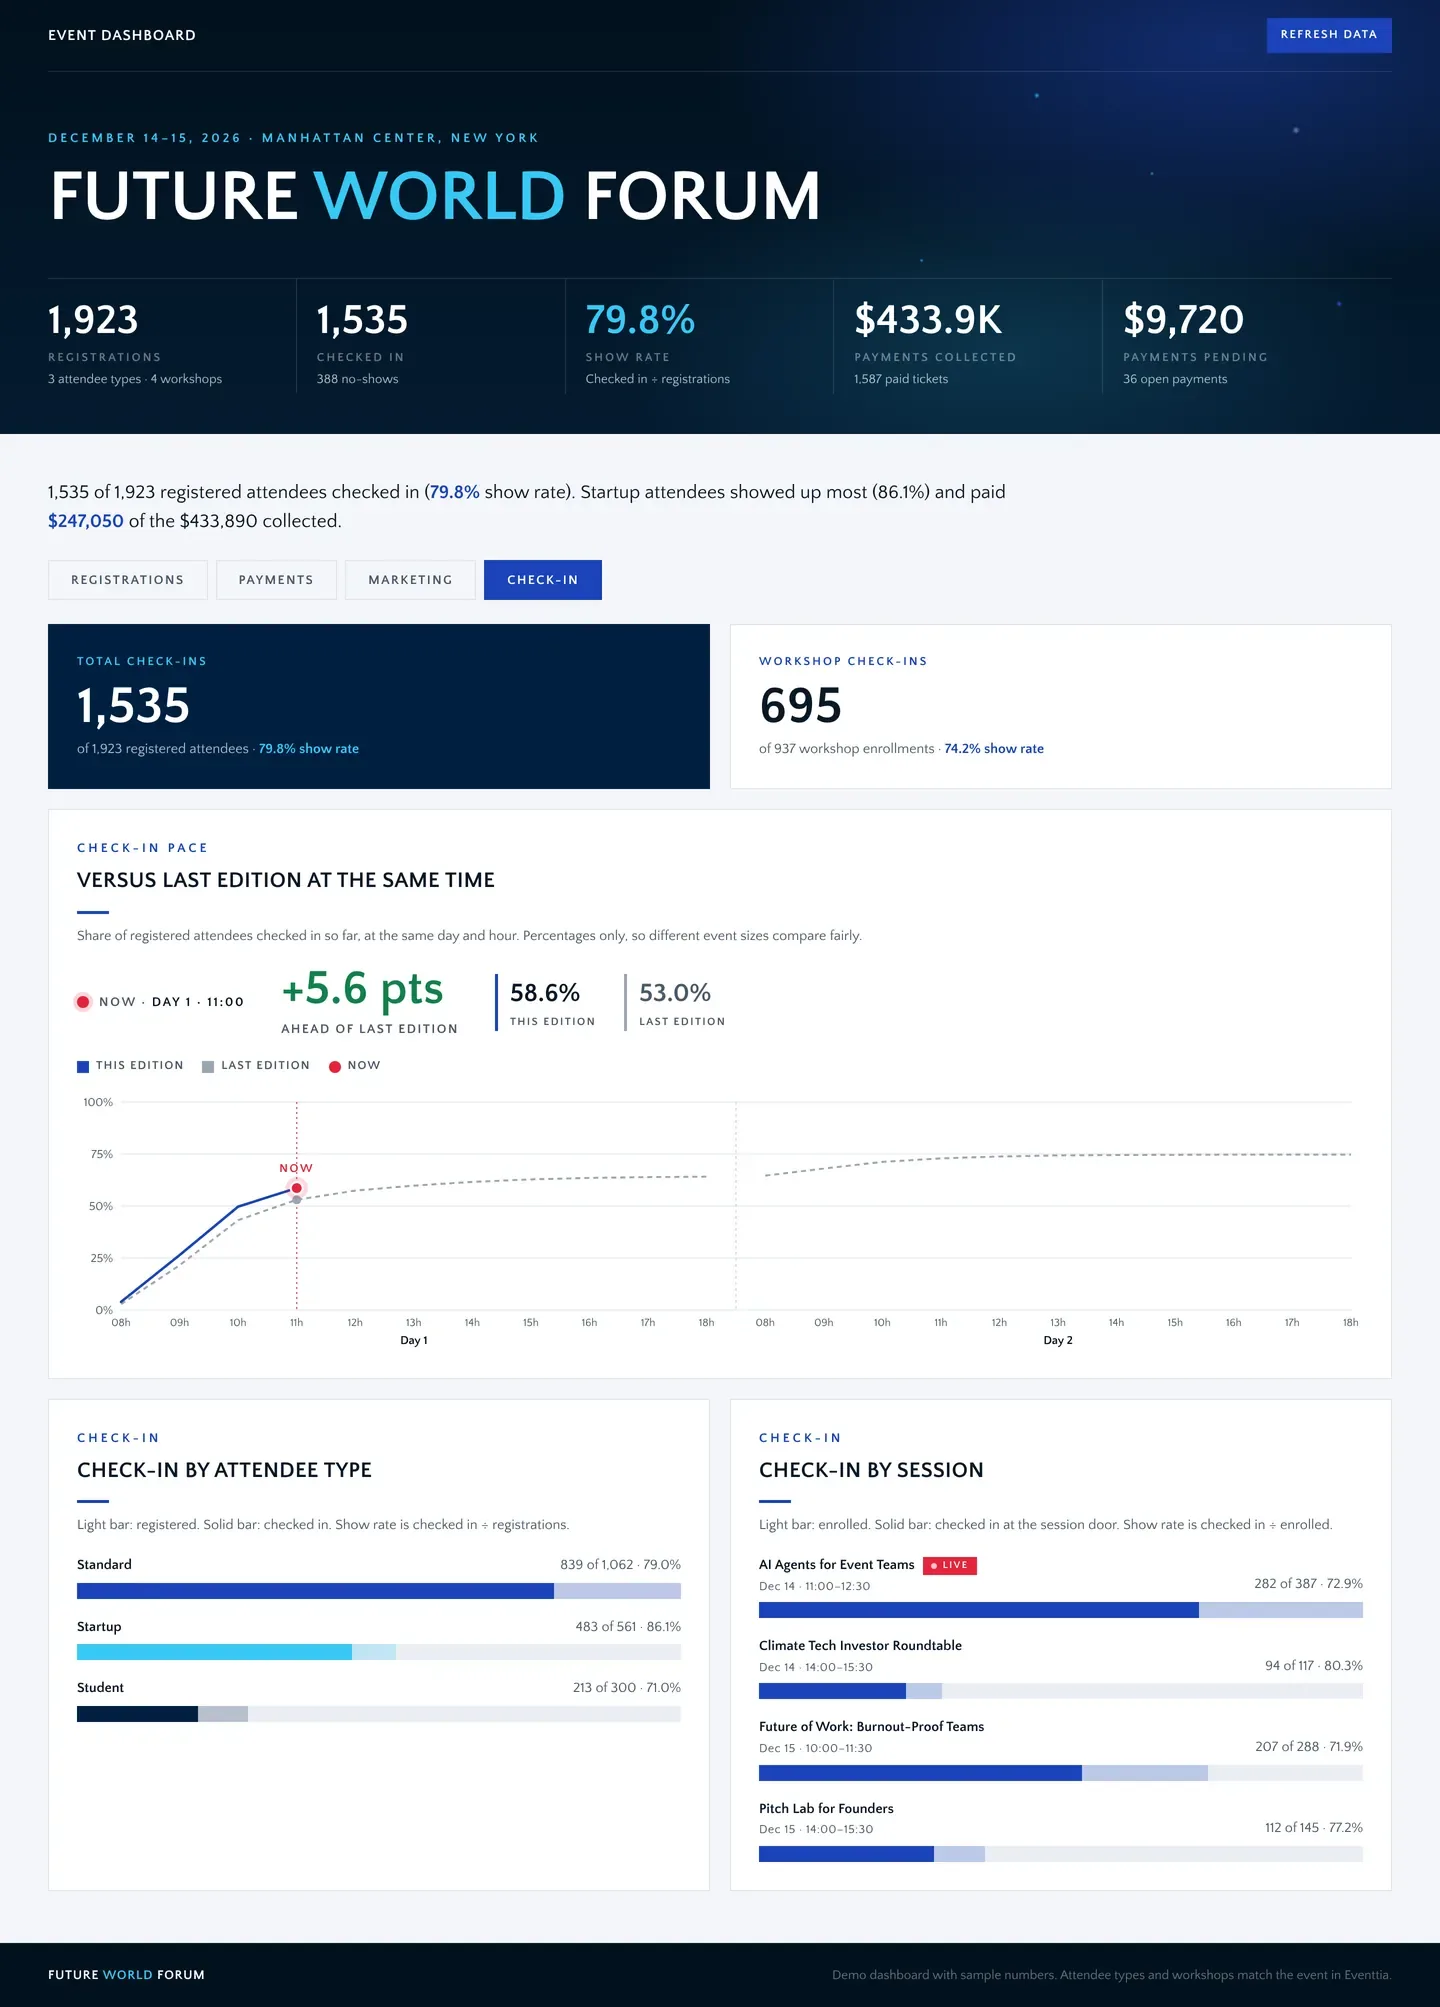
Check-in tab: who is here now, compared with last year
How do you use the dashboard during the event?
Keep it open on your phone and use it every time someone asks you a question you cannot answer from memory. You answer on the spot, with real numbers, instead of looking for a colleague with a laptop.
Here is a common example. At 11:00 on Day 1, an exhibitor tells you their booth has been empty for a while. They ask two questions: is attendance lower than last year? And if not, where is everyone? You open the Check-in tab:
- You see that 58.6% of registered attendees have checked in, against 53.0% at the same hour last year. That is 5.6 points ahead.
- You see that the AI Agents for Event Teams session is live, with 282 attendees in the room.
You give a clear answer in 10 seconds, and you can plan better traffic for the exhibition area next time. The dashboard also helps your whole team: no more spreadsheets built before every meeting, and everyone works from the same numbers.
Compare with the same hour, not with the final count. At single-day in-person events on Eventtia, 30% of attendees check in an hour or more after the start (10,085 events, 935,000 check-ins). A low number at 9:15 is often normal. The pace against last year tells you if it is not.
How does Expomedia share event data with its exhibitors?
Expomedia, a trade show organizer, used the Eventtia MCP server for its last show, Le Salon des Métiers de Bouche in Montpellier. The team now shares reliable data with exhibitors and builds complete reports in a few minutes.
What are the limits to know?
A Claude dashboard is powerful, but it has rules. Here are the ones that matter for event teams:
- Sharing: live data only works for people in your Claude organization (Team and Enterprise plans). For anyone else, the parts that use connected apps do not work.
- Access: every viewer needs a Claude account and their own connection to the same tools. They see only what their own permissions allow.
- Refresh: the dashboard loads fresh data when you open it or click Refresh. It is not a second-by-second feed.
- Coverage: the Eventtia MCP server covers events, attendees, registration, sessions, workshops, speakers, check-in and payments. Survey results, web traffic and email campaigns are not covered yet, so use the Eventtia dashboard or the tool that holds them.
- Checking: the first time, compare the main numbers with Eventtia. Then trust the dashboard.
How can you go further with Claude and Eventtia?
A dashboard is only one way to use Claude with your event data. Claude can also set up events, build registration forms, create check-in points and write your post-event report. Watch our complete guide:
Keep learning with these guides:
- How to use Claude for event planning: set up, run and report on events with real prompts.
- How to write a post-event report: turn your event data into a clear report.
- How to measure event success: the metrics that matter, and how to track them.
- Eventtia event data and analytics: live dashboards, reports, exports and API.
- Eventtia MCP server: connect Claude, ChatGPT, Microsoft Copilot or the assistant you use.
Frequently asked questions
Do I need to know how to code to build an event dashboard with Claude?
No. You describe the dashboard in plain language and Claude builds it. You can change it the same way, by asking.
Which Claude plan do I need?
A paid plan: Pro, Max, Ultra, Team or Enterprise. Pro is enough to build and use a dashboard yourself. To share a live dashboard with your team, you need a Team or Enterprise plan.
What is the price of the Eventtia MCP server?
The Eventtia MCP server is included with every Eventtia plan. There is no add-on to buy, no usage tier and no expiry date. If you are an Eventtia customer, you already have it. You only pay for your Eventtia plan, plus the Claude plan you choose. See the plans on Eventtia’s pricing page.
Is my event data safe?
Claude only gets the access of the Eventtia account you sign in with. If your role cannot see an event, Claude cannot see it either. Eventtia does not train AI models on your prompts or your event data. Your AI provider has its own data policy, so check it too.
Does the dashboard update automatically?
It loads fresh data from Eventtia when you open it and when you click the Refresh button. You do not need to export or import anything.
Can I use ChatGPT or Microsoft Copilot instead of Claude?
The Eventtia MCP server works with any assistant that supports MCP, including ChatGPT and Microsoft Copilot. The steps in this guide are for Claude dashboards. Other assistants have their own ways to build and share pages.
Can I build one dashboard for all my events?
Yes. Claude can read every event in your Eventtia account, within your permissions. Ask for a dashboard that compares registrations, show rates or revenue across events.
Conclusion: one live view, for the whole team
For years, a live event dashboard needed a designer, a developer and days of work. Today, with Claude and Eventtia connected via MCP, you build it in minutes, with one prompt. Your team saves the hours spent on spreadsheets, and gets the numbers it needs to make better decisions every day.
Connect Eventtia to Claude or book a live demo to see it on your own events.
Eventtia is the platform behind the brands setting the standard.
Talk to us about how the platform fits into your stack: registration, communications, on-site and analytics, exposed deeply enough to compose.