Your event is over. Your director wants to know if it worked, and your sponsors want numbers. A post-event report answers both questions, but building one by hand often takes days of spreadsheet work.
We have worked with event teams for 12 years, and we see the same pattern after almost every event. Event day is intense: months of preparation, a few hours of pressure, things that go well and things that go wrong. When it ends, the team is tired and the next project is already waiting. The report shrinks to a few key numbers, and the lessons stay in people’s heads. Those numbers still decide the next budget, so they need to be right. This is the part AI now makes much faster.
This guide shows you how to write a post-event report with AI. You get 7 steps, a prompt for each step, one master prompt to copy, and a complete example report built on a sample event. The prompts are written for Claude, ChatGPT and Microsoft Copilot.
Post-event report: Quick summary
| Step | What you do | What AI does |
|---|---|---|
| 1. Give your goals | Share the targets set before the event | Uses them as the frame for the whole report |
| 2. Pull the data | Ask for registrations, check-ins and payments | Reads them from your event software and checks for gaps |
| 3. Calculate your metrics | Check the formulas | Calculates attendance rate, no-shows, revenue and goals vs. results |
| 4. Find the patterns | Confirm what happened on site | Compares passes, check-in times, registration dates and sessions |
| 5. Add survey and costs | Upload survey results, budget and costs | Calculates NPS, groups comments, builds plan vs. actual |
| 6. Share your event page | Give the link to your event page | Uses your colors, fonts and style |
| 7. Write the report | Check every number, approve the actions | Drafts the report as slides or a document |
What is a post-event report?
A post-event report is a document that compares an event’s results with its goals and turns what happened into decisions for the next edition.
Different people read it for different reasons. Your director wants to know if the event was worth the money. Finance wants revenue, costs and profit. Sponsors want proof of visibility and leads. Your team wants to know what to fix.
The same report can take two forms. A slide deck works best for a meeting with your director. A document works best for finance, sponsors and your archive. The content is the same, only the layout changes.
What should a post-event report include?
A complete post-event report has 10 sections, from an executive summary to a list of actions. Most of the data comes from your event platform. The rest comes from your budget, your survey and your own notes.
| Section | Question it answers | Where the data comes from |
|---|---|---|
| 1. Executive summary | Did the event work? | All other sections |
| 2. Goals vs. results | Did we hit our targets? | Goals set before the event |
| 3. Registrations | How many people signed up, when and from where? | Event platform |
| 4. Attendance and check-in | Who came, and when did they check in? | Event platform |
| 5. Sessions | Which sessions did people attend? | Event platform (check-in points) |
| 6. Attendee feedback | What did attendees think? | Post-event survey |
| 7. Finances | Did we make money? | Event platform (recorded payments), budget, invoices |
| 8. Sponsors | Did sponsors get value? | Sponsor survey and contracts |
| 9. Operations | How did the venue, catering and logistics work? | Your notes and supplier invoices |
| 10. Actions for next time | What do we change? | Your team, with an AI draft |
Each section needs a few clear metrics. These are the ones event directors use most:
| Metric | Formula | Fictional example: Future World Forum |
|---|---|---|
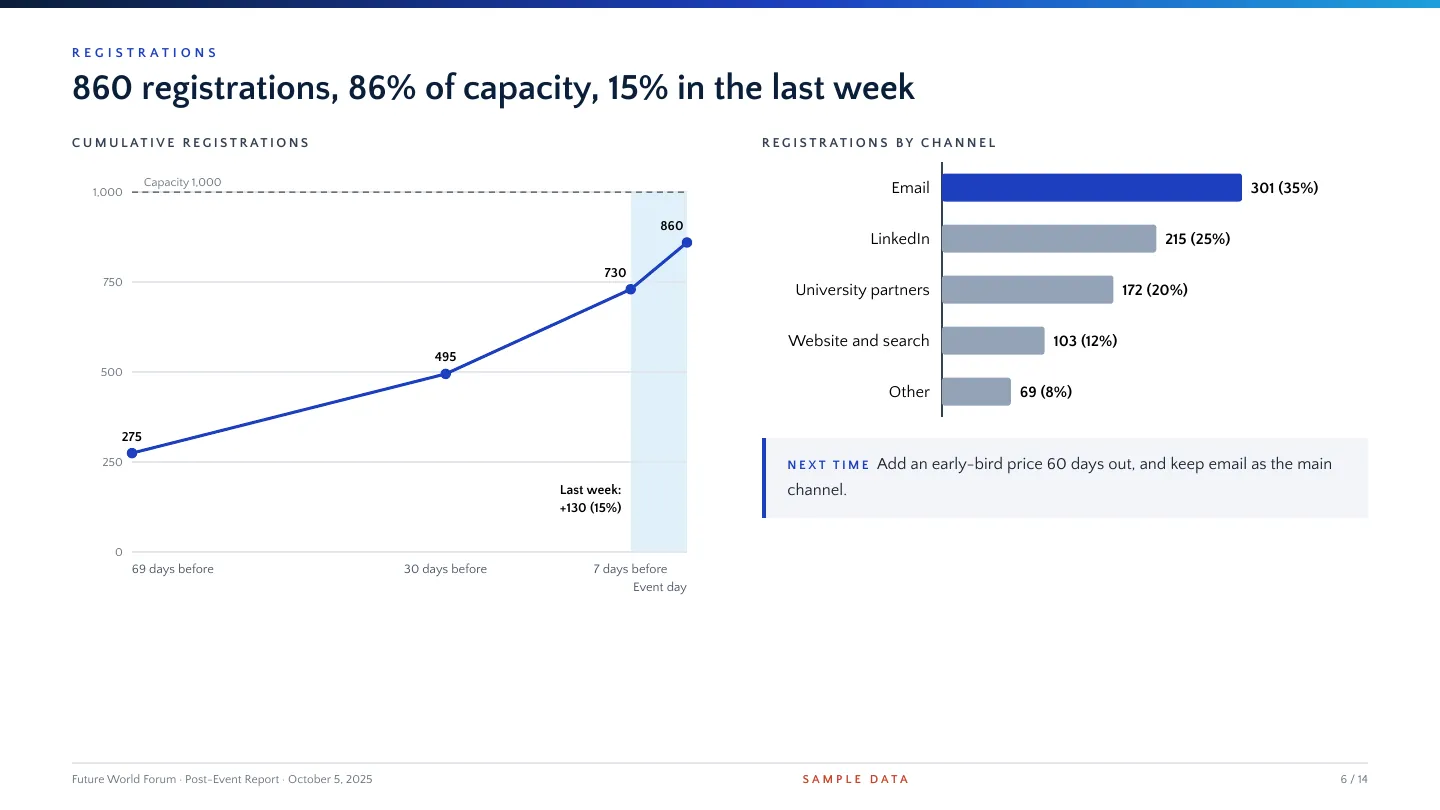
| Capacity filled | Registrations ÷ capacity | 860 ÷ 1,000 = 86% |
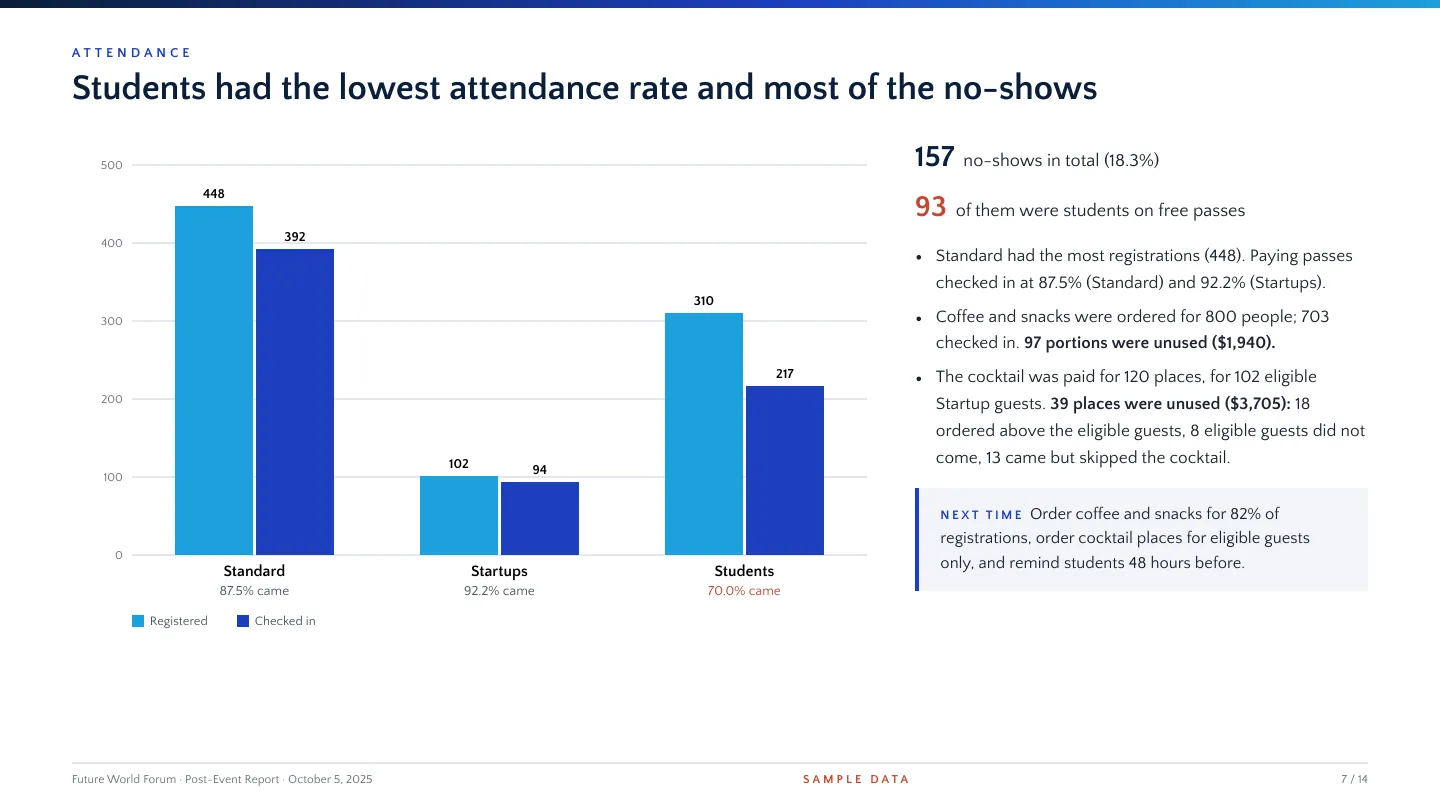
| Attendance rate | Attendees checked in ÷ registrations | 703 ÷ 860 = 81.7% |
| No-show rate | No-shows ÷ registrations | 157 ÷ 860 = 18.3% |
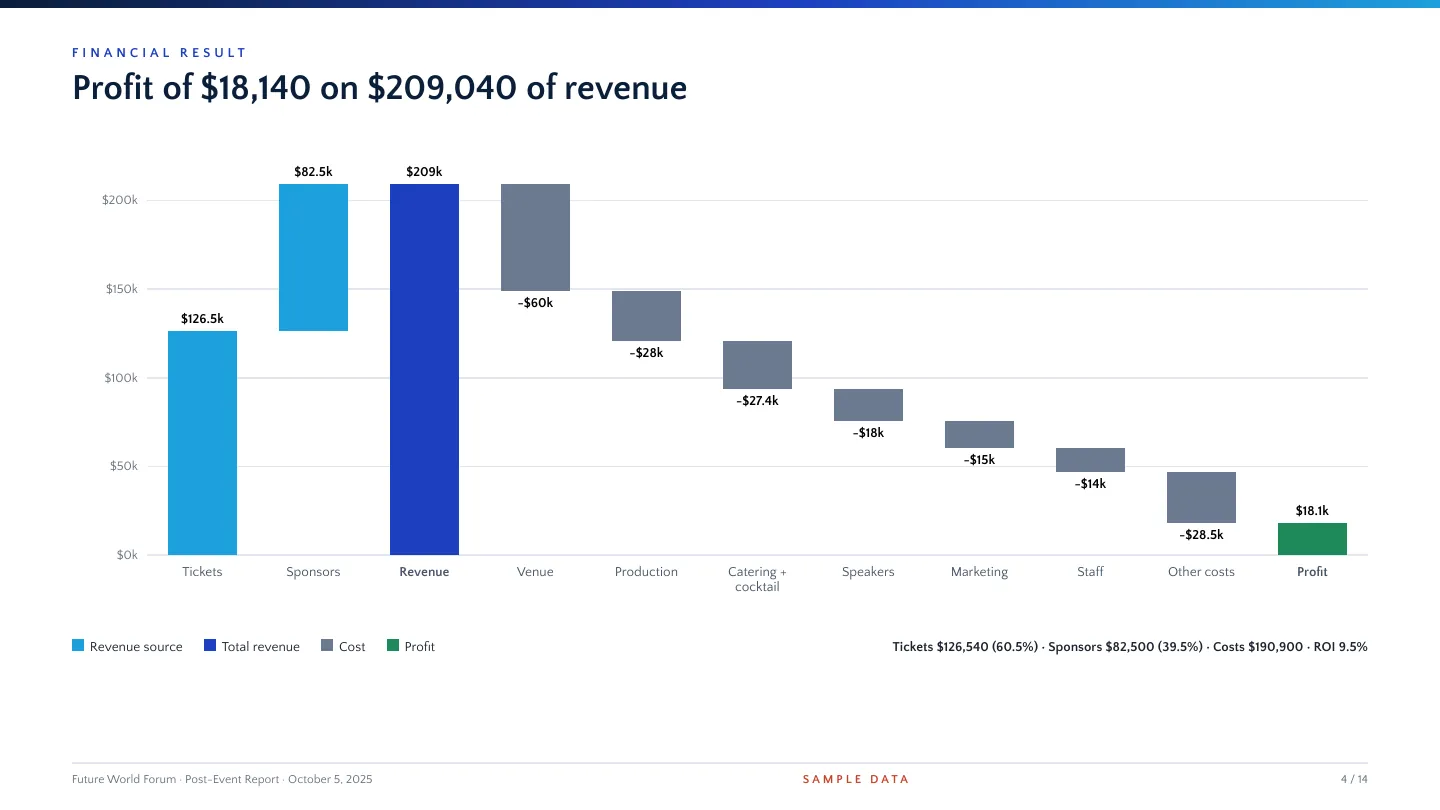
| Profit | Revenue − costs | $209,040 − $190,900 = $18,140 |
| ROI | Profit ÷ costs | $18,140 ÷ $190,900 = 9.5% |
| Profit margin | Profit ÷ revenue | $18,140 ÷ $209,040 = 8.7% |
| Cost per attendee | Costs ÷ attendees | $190,900 ÷ 703 = $272 |
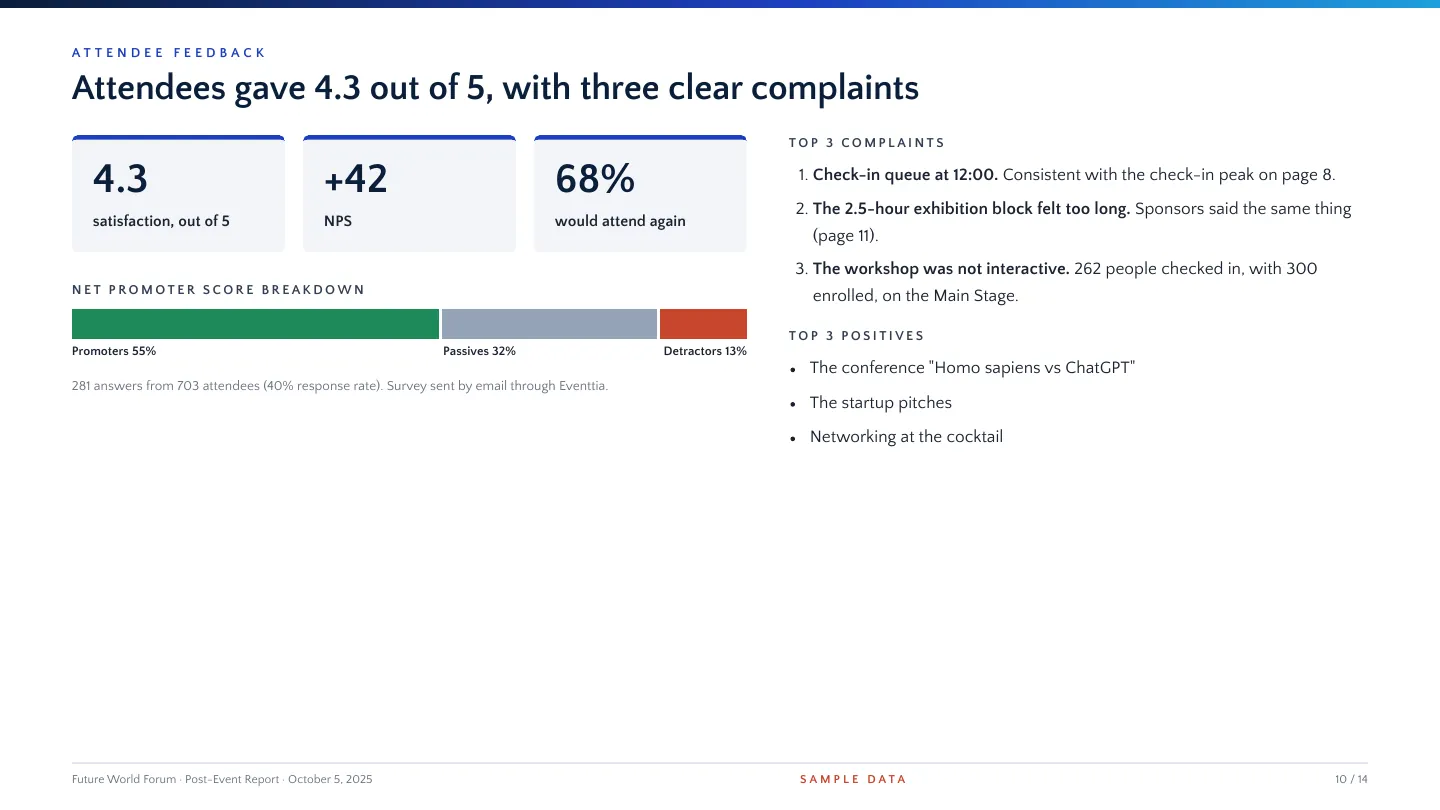
| Net Promoter Score (NPS) | % promoters − % detractors | 55% − 13% = +42 |
| Survey response rate | Answers ÷ attendees | 281 ÷ 703 = 40% |
What does an AI-written post-event report look like?
It looks like a short deck where every title states a finding and every problem comes with an action. Below is a complete example written with AI for the 2025 edition of Future World Forum, a one-day conference on AI and work held in New York on September 14, 2025. The report is dated October 5, 2025.
About this example: Future World Forum is a fictional demonstration event. All numbers are sample data, created to show what a full report can look like.
The report finds 5 things an event director needs to know:
- People came and liked it. 860 registrations filled 86% of capacity, 81.7% checked in, and survey respondents gave an NPS of +42.
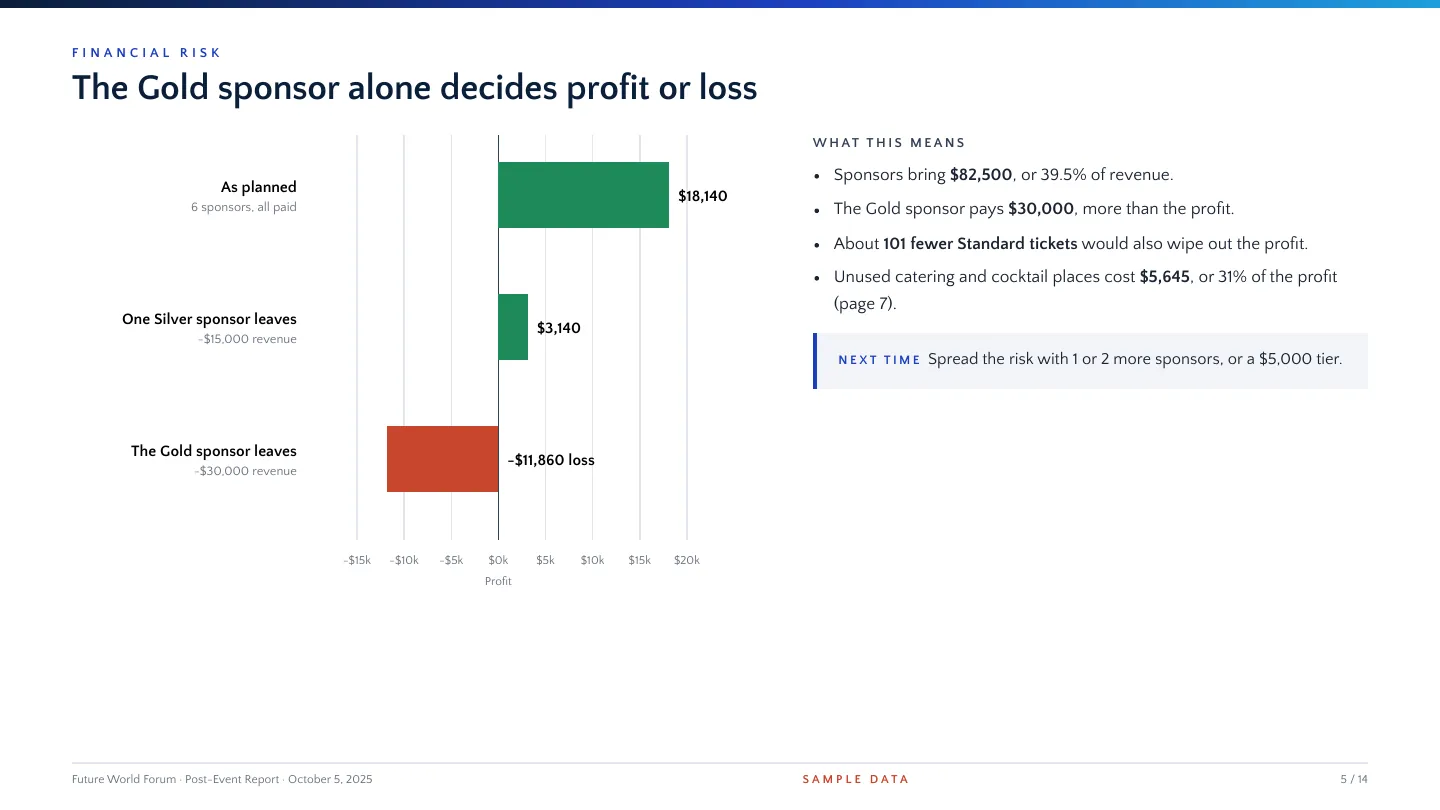
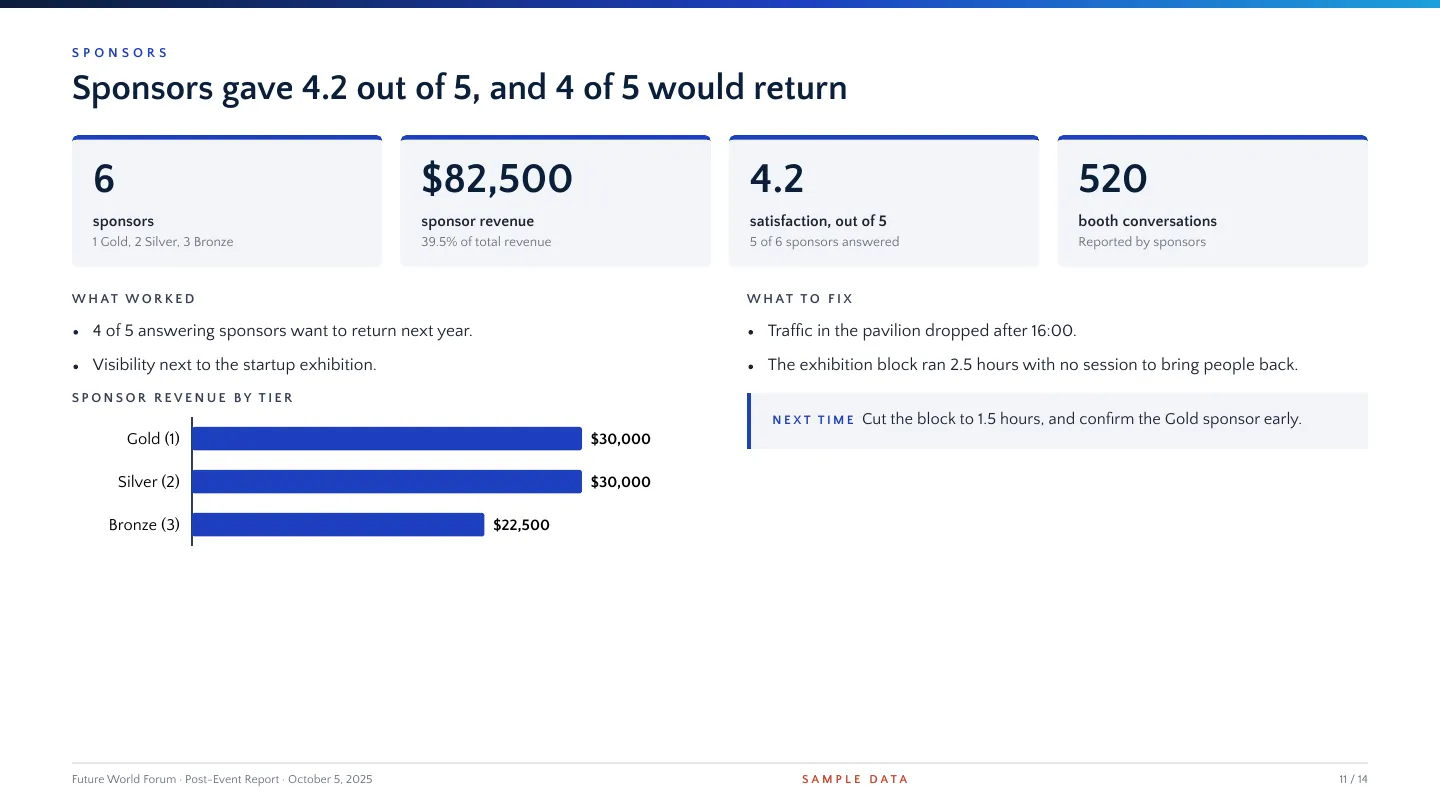
- The money is fragile. Profit was $18,140, an 8.7% margin. If the $30,000 Gold sponsor does not return and costs stay the same, the event loses $11,860.
- Students were the weak spot. They had the lowest attendance rate (70%) and 93 of the 157 no-shows.
- $5,645 of catering went unused. $1,940 was general catering ordered for 800 people when 703 checked in. $3,705 was the cocktail, where 18 of the unused places were ordered above the number of eligible guests.
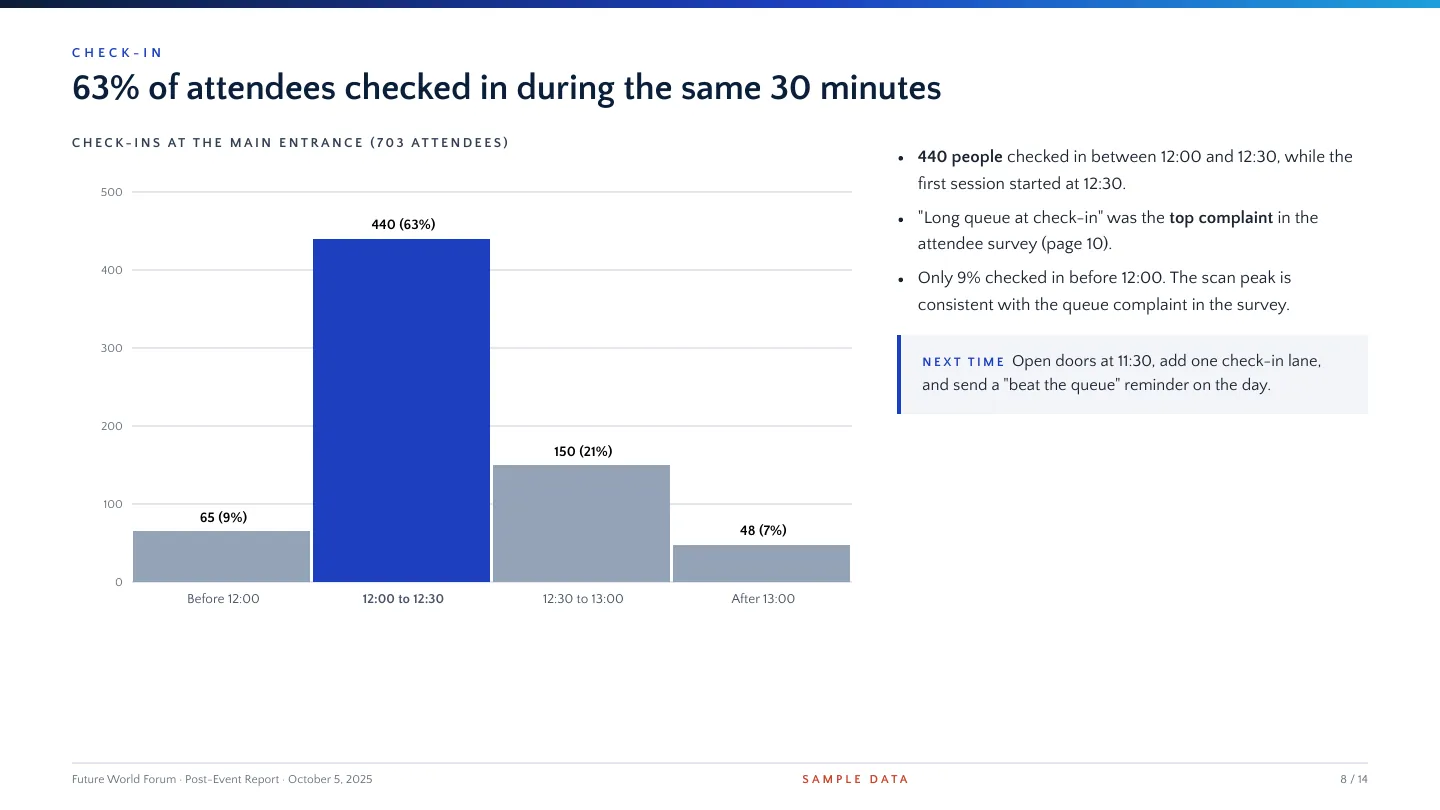
- Check-in had one big peak. 63% of attendees checked in during the same 30 minutes, and the queue was the most mentioned complaint in the survey.
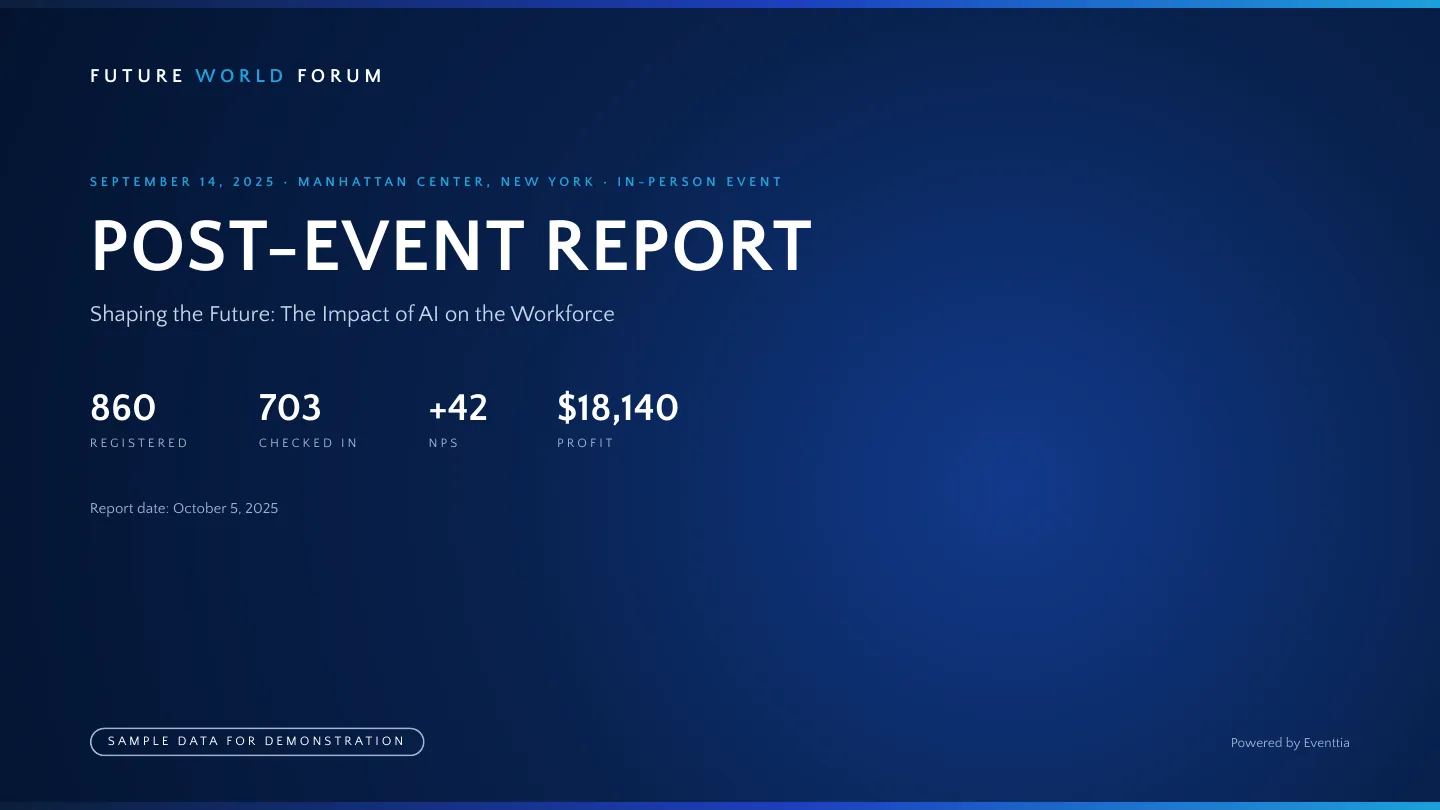
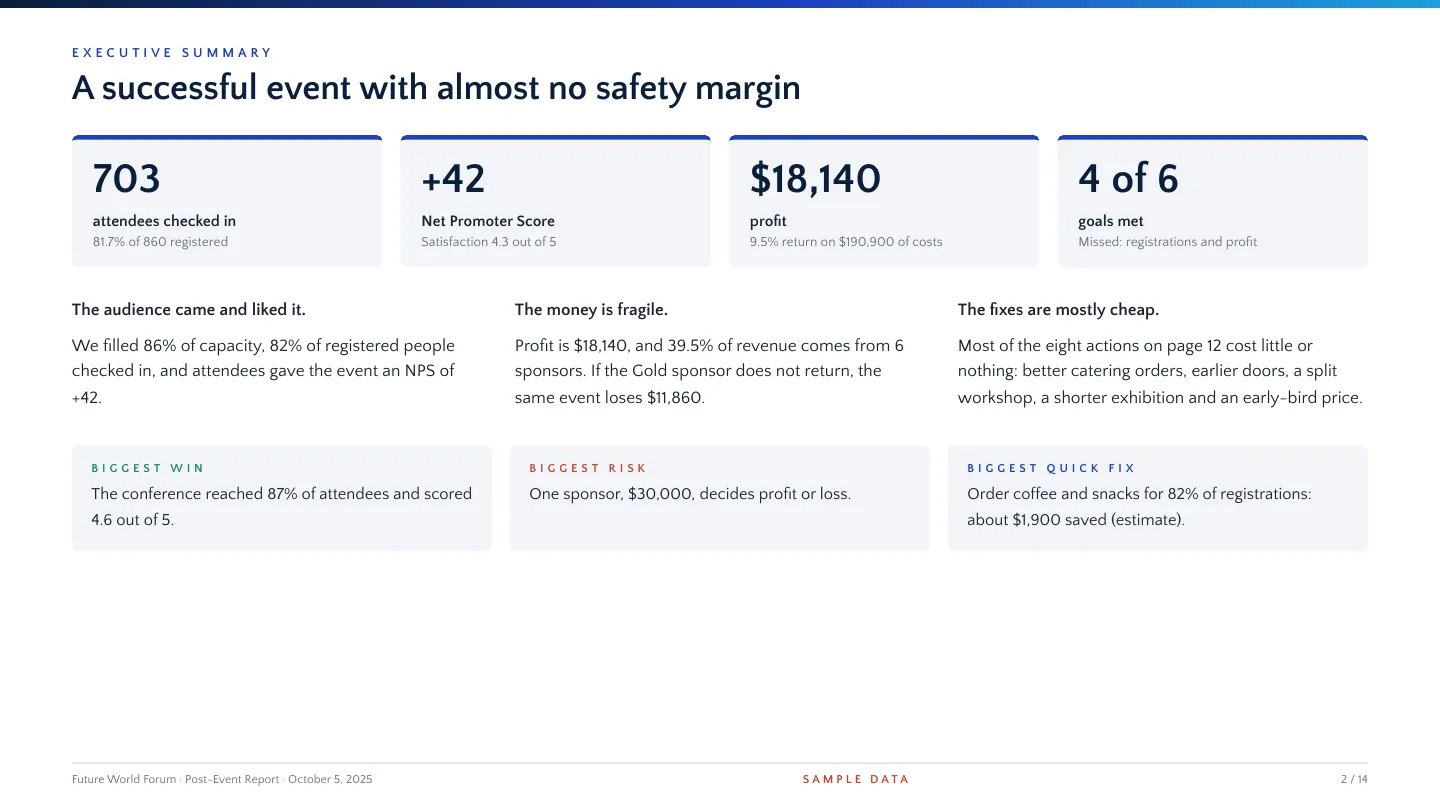
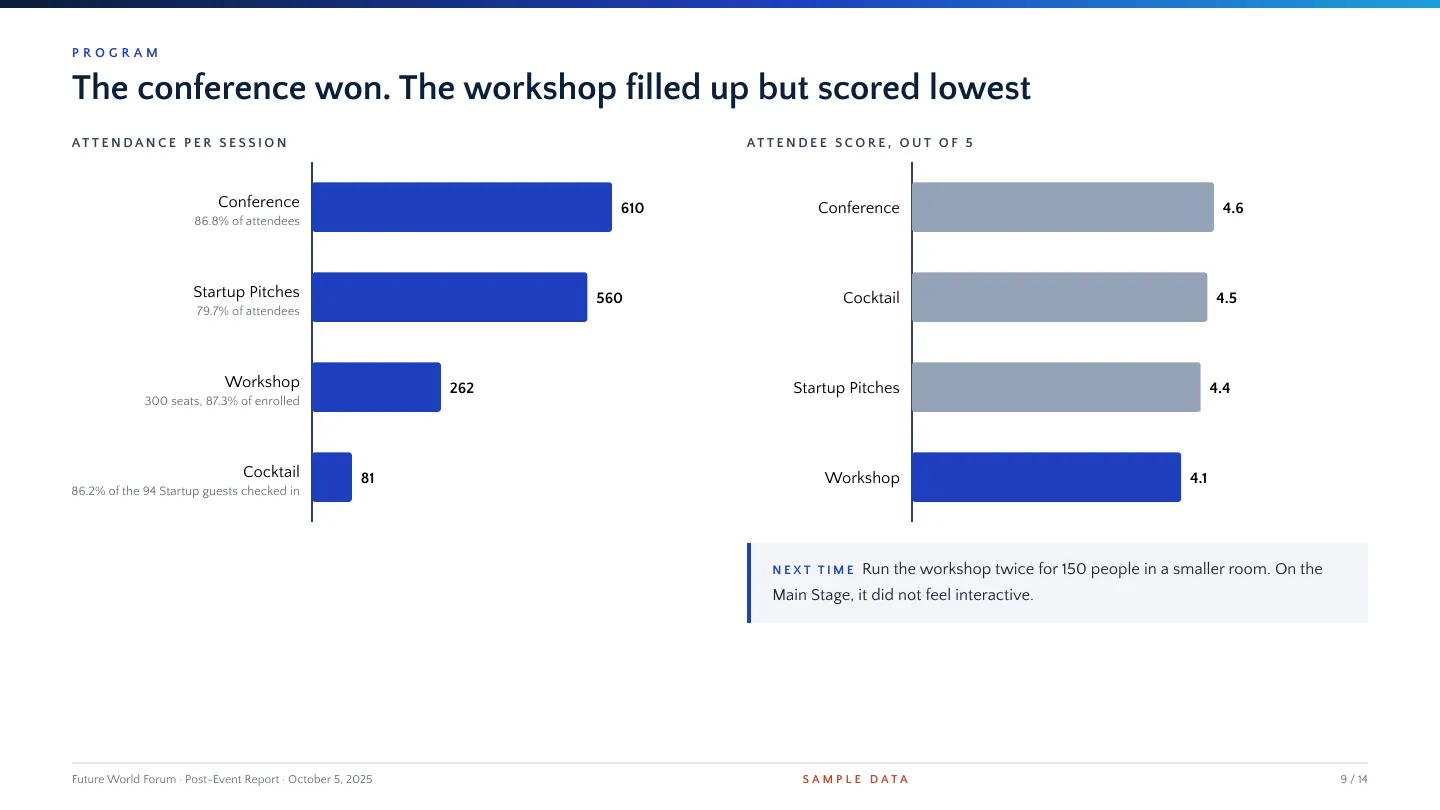
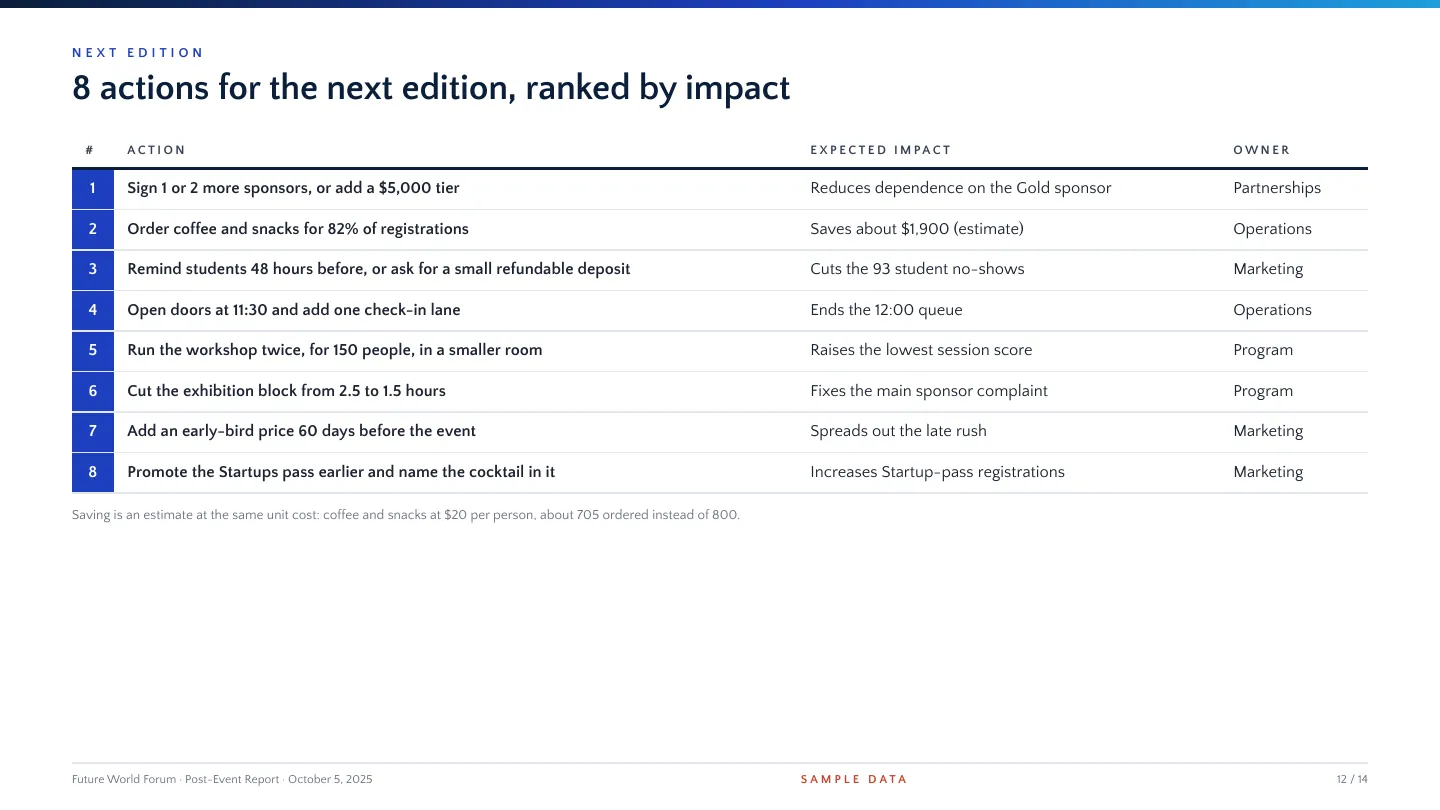
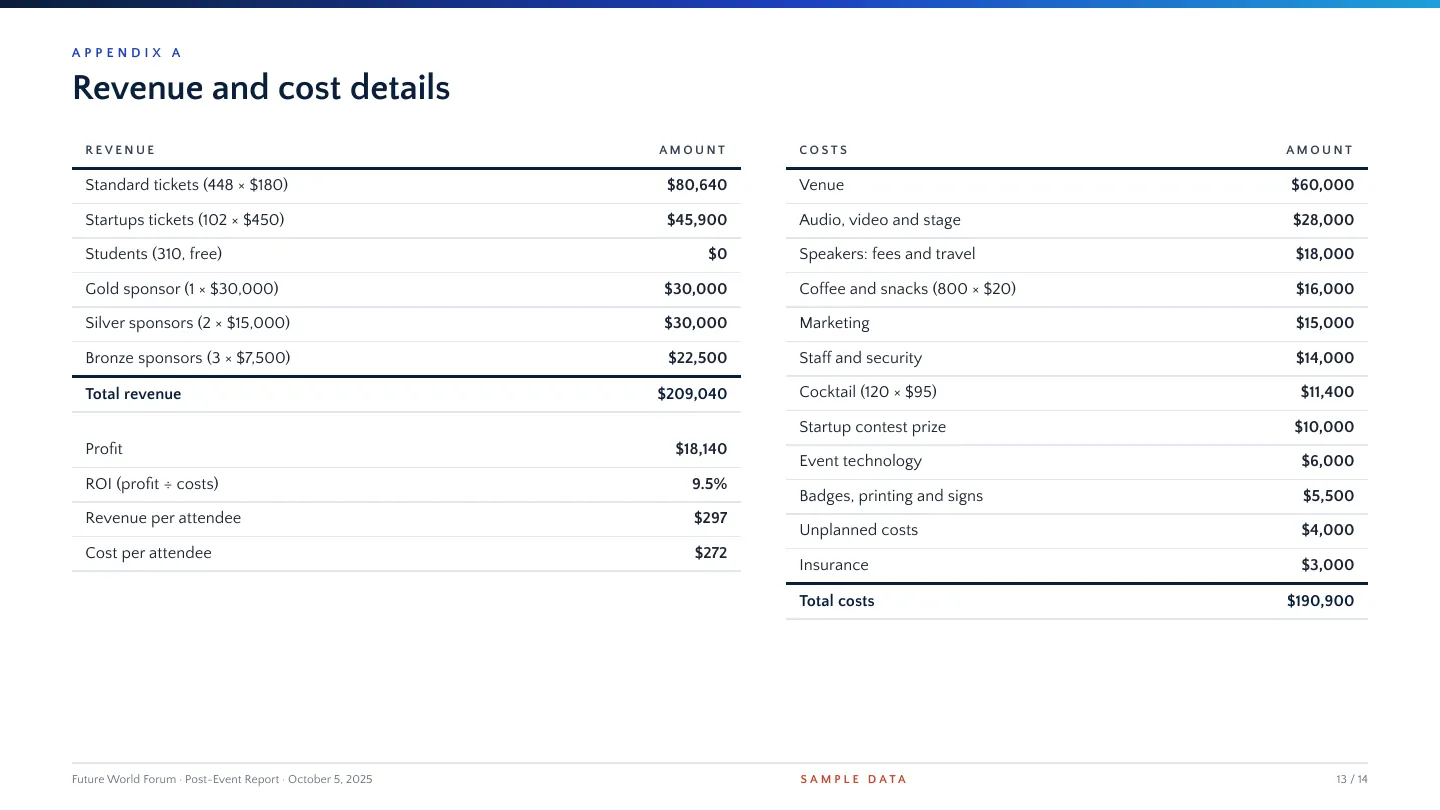
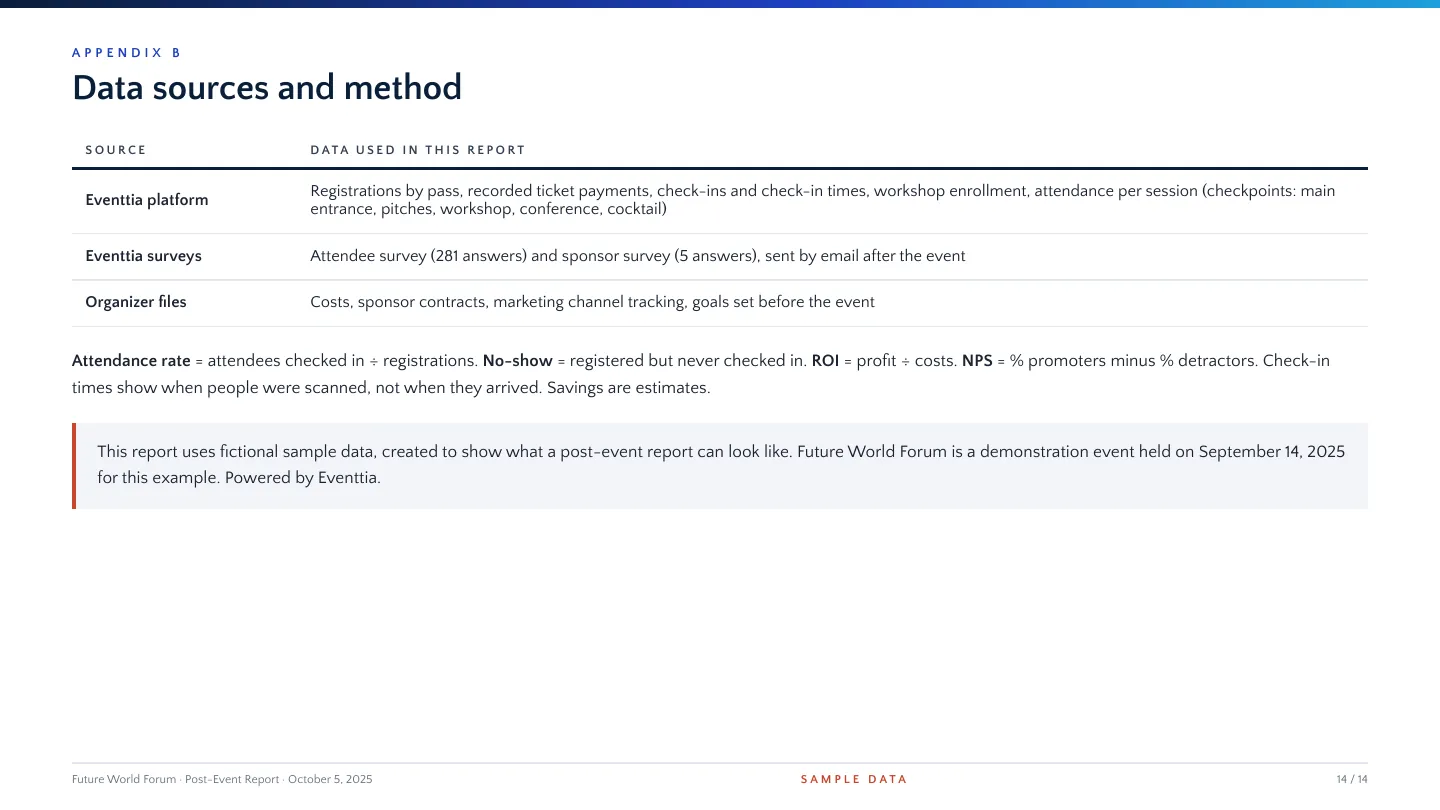
Fictional example with sample data. Swipe or use the arrows to browse the 14 pages.
How do you write a post-event report with AI, step by step?
If your event software is connected to your AI assistant, the assistant can read your registrations, payments and check-ins directly. You give it your goals, add the few files it does not have, and ask it to calculate, analyze and draft. You check the numbers and decide the actions. The 7 steps are:
- Give the AI your goals.
- Ask the AI to pull and check your event data.
- Calculate your key metrics.
- Find the patterns behind the numbers.
- Add your survey results and costs.
- Share your event page for the visual identity.
- Write the report and the actions.
Work in one conversation, step by step. Each answer becomes the base for the next one, and you can correct mistakes before they reach the final report.
No AI connection yet? Export your registrations, check-ins and payments from your event software as Excel files, and upload them to the conversation. The same prompts work. In Eventtia, see how to export your attendees.
Step 1: Give the AI your goals
Your event software knows your passes, your program and your registrations. It does not know what you were trying to achieve. Start with your goals, so the AI can judge the results against them.
We will write the post-event report for [event name] in [event software].
Event date and time zone: [date, time zone].
Goals set before the event: [registrations, attendance rate, profit, satisfaction, NPS, sponsors].
The report is for [my director].
Use only data from [event software] and the files I give you.
Never invent a number. If data is missing, ask me for it.
Rules for this whole conversation:
- Count only confirmed registrations, unless I say otherwise. Use the same group for every rate.
- Count unique people, not scans. Keep event check-in, workshop enrollment, workshop check-in and checkpoint check-in separate.
- Ticket revenue = accepted ticket payments minus refunds, in [currency], up to [cutoff date]. Exclude pending and failed payments. Do not add invoice charges to payments. Tell me if taxes are included.
- Total revenue = ticket revenue + sponsor income + other income received, on the same basis. If income records are missing, ask me before you calculate profit or margin.
- Keep facts apart from causes. If you are not sure of a cause, write “possible cause”.
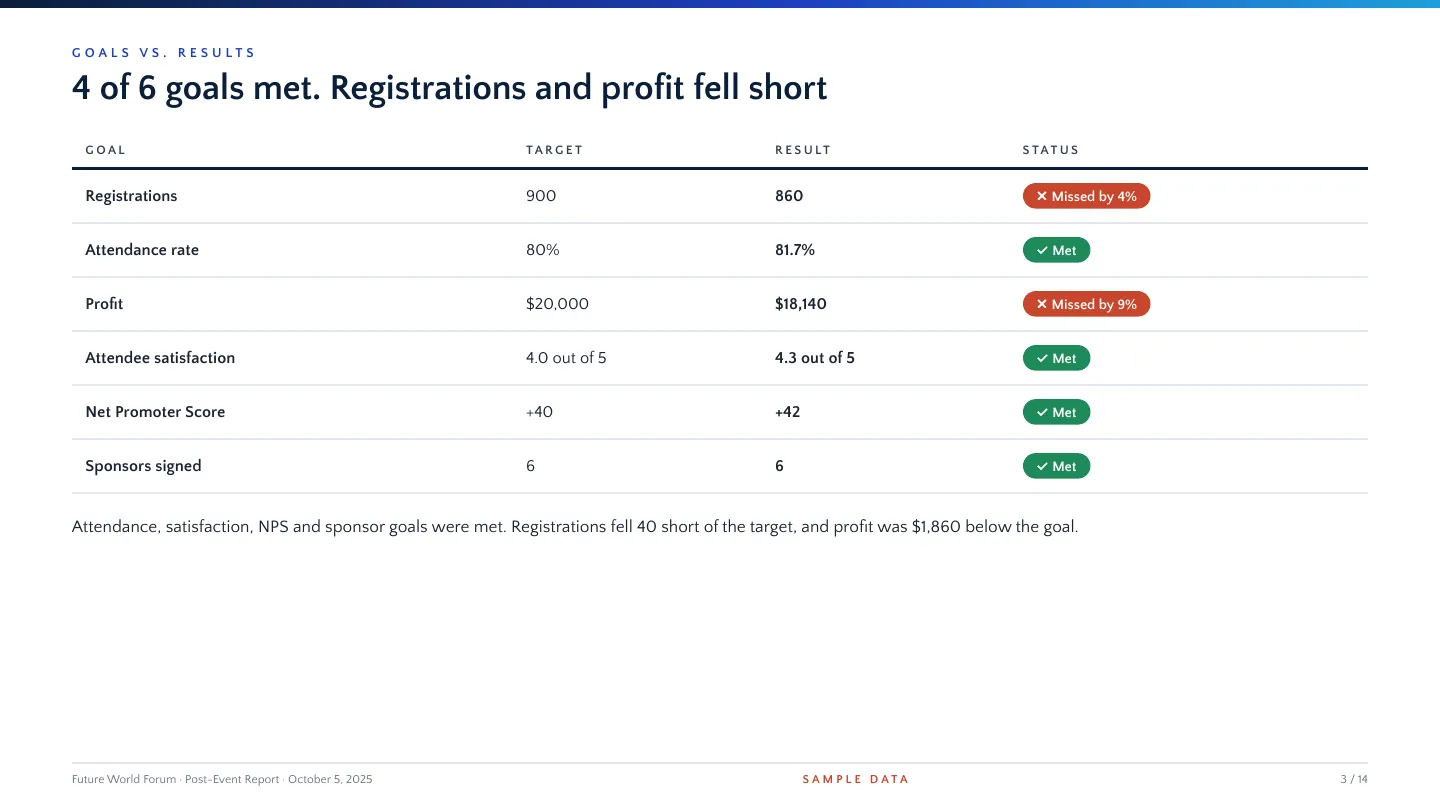
For Future World Forum, the team set 6 goals before the event, including 900 registrations, an 80% attendance rate and a $20,000 profit.
Step 2: Ask the AI to pull and check your event data
Ask the AI to collect the data and check it before it analyzes anything. Missing records and duplicates are the most common source of wrong numbers. Large events return records page by page, so ask the assistant to confirm it read every page.
Get all attendees of [event name]: attendee type, registration status, registration date, payment status, check-in status and check-in time. Also get workshop enrollment and workshop check-ins, and check-ins at each checkpoint.
Include only these statuses: [confirmed]. Exclude: [draft, rejected, archived].
Read every page of results. Tell me how many records you read, and check it against the total for the same filter. If the event summary shows a different total, show both and explain the difference.
Count unique people, not scans: one person can be scanned several times.
Tell me if anything looks missing or duplicated. Do not analyze yet.
For Future World Forum, this gave 860 registrations across 3 passes, 703 check-ins with their times, and the attendance of each workshop.
Also check that “attended” means the same thing in every number. Registered, badge printed and checked in are three different counts. If your team printed badges on site, compare the check-in total with your own count at the door. A badge printed without a scan does not show as a check-in, and a gap here changes every rate in the report.
Step 3: Calculate your key metrics
Ask for the formula behind every number. This makes each result easy to check.
Calculate by pass type: registrations, check-ins, attendance rate, no-shows and ticket revenue.
Use the ticket revenue rule above, not ticket price × registrations. Free passes count as zero revenue, not as unpaid.
Show each formula and the numbers you used.
Then compare the results with the goals you can check now: target, result, met or missed. Mark the other goals as “waiting for data”.
For Future World Forum, the attendance goal was met (81.7% against 80%), and the registration goal was missed (860 against 900). Profit, satisfaction and NPS wait for Step 5. For the full list of event KPIs and their formulas, see our guide on how to measure event success.
Step 4: Find the patterns behind the numbers
Totals tell you what happened. Patterns show you where to look, and what to change. Ask AI to compare groups and time periods, and to keep facts apart from possible causes.
Find the 3 most important patterns in the registration and attendance data.
Look at: attendance rate by pass type, check-ins by 30-minute slot (in [time zone]), registrations by week before the event, and attendance per session.
Keep these apart: workshop enrollment, workshop check-in, event check-in and session check-in.
For each pattern, give the number, a possible cause, the data that would confirm it, and one action.
This step produced 3 of the report’s main findings: students had the lowest attendance rate (70%), 63% of attendees checked in between 12:00 and 12:30, and 15% of registrations came in the last week.
Check-in data by hour is often where the most useful insight is. As one Eventtia customer put it:
“Analysing check-ins by activity and by hour showed us anomalies we could never detect before. It let us decide on targeted corrective promotions while the show was still running.” David Amstutz, Show organiser, Expomedia
Step 5: Add your survey results and costs
An AI connection rarely covers everything a report needs. In Eventtia, you send the survey from the platform and download the results. Your budget and supplier costs live in your own files. Upload all of them to the same conversation.
Here are my survey results, my budget, my final costs, and my sponsor and other income.
- Calculate the average satisfaction, the NPS (promoters 9 to 10, detractors 0 to 6) and the response rate (answers ÷ attendees checked in). Group the written comments into themes and count the comments in each theme.
- Build a table of plan vs. actual for each revenue and cost line. Calculate profit, ROI (profit ÷ costs) and margin (profit ÷ total revenue).
- Show the profit if my biggest sponsor does not return next year, assuming costs stay the same.
- Compare what we ordered (catering, places) with the check-in numbers. Separate three causes: places ordered above the number of eligible guests, registered people who did not come, and attendees who did not use the service.
- Complete the goals table: target, result, met or missed.
For Future World Forum, 281 attendees answered the survey and the top complaint was the check-in queue. With the survey and costs added, the goals table is complete: 4 of 6 goals were met, and registrations and profit fell short. On the finance side, if the Gold sponsor leaves, the event loses $11,860. Comparing orders with check-ins found $5,645 of unused catering: $1,940 of general catering and $3,705 at the cocktail.
Step 6: Share your event page for the visual identity
Your report should look like your event. Share the link to your event page, and the AI uses its colors, fonts and style for the report.
Here is my event page: [URL]. Use its colors, fonts and visual style for the report.
Some event pages load their design with code that AI assistants cannot read. If the result does not match your brand, upload a screenshot of the page instead. The Future World Forum report uses the navy, blue and cyan of the event page, and its font.
Step 7: Write the report and the actions
Now ask AI to put everything together. Give it clear rules about format and style.
Write the post-event report as a [12-slide deck / 5-page document] for my director.
Start with a 3-sentence summary. Each title states a finding, not a topic.
End each section with one action for next time.
Finish with a table of actions: action, expected effect, owner.
Label every saving as an estimate and show how you calculated it.
Use only the numbers above.
You write the final recommendations. AI can suggest actions, but only your team knows the budget, the suppliers and the constraints behind each decision.
Which prompt can you copy to write the full report at once?
Use the master prompt below. It combines the 7 steps in one message. Fill in the parts in brackets, attach your survey results and costs, and send.
You are helping me write a post-event report for [EVENT NAME].
ABOUT THE EVENT
- Date, time zone and venue: [date, time zone, venue]. Capacity: [number].
- Passes and prices: [list].
- Program: [sessions with times and capacity].
- Goals set before the event: [registrations, attendance rate, profit, satisfaction, NPS, sponsors].
- Reader of the report: [my director / my sponsors / my team].
MY DATA
- Use the [event software] connection to read all data for event [name]: attendees, attendee types, registration statuses and dates, payments and refunds, event check-ins, workshop enrollment, workshop check-ins and checkpoint check-ins.
- Include only these statuses: [confirmed]. Exclude: [draft, rejected, archived].
- I also attached: survey results, budget, final costs, and sponsor and other income.
VISUAL IDENTITY
- Use the colors, fonts and visual style of my event page: [URL].
WHAT TO DO
- Check the data first. Read every page of results. List what you have and the record counts, and check each count against the total for the same filter. List what is missing, and any duplicates. Ask me before you continue if something important is missing.
- By pass type, calculate: registrations, check-ins, attendance rate, no-shows and ticket revenue (see the ticket revenue rule below). Show each formula.
- Compare the results with my goals: target, result, met or missed.
- Find patterns: attendance by pass, check-ins by 30-minute slot, registrations by week, attendance per session.
- Summarize the survey: satisfaction, NPS (promoters 9 to 10, detractors 0 to 6), response rate, and the top 3 positive and negative themes with the number of comments for each.
- Build plan vs. actual for revenue and costs. Calculate profit, ROI (profit ÷ costs) and margin (profit ÷ total revenue). Show the result if my biggest sponsor does not return, with costs unchanged.
- Compare what we ordered (catering, places) with what was used. Separate over-ordering, no-shows and attendees who did not use the service.
HOW TO WRITE THE REPORT
- Format: [slide deck / document].
- Start with a 3-sentence summary: what went well, what is at risk, what to fix first.
- Each title states a finding, not a topic. Example: “Students had the lowest attendance rate”, not “Attendance”.
- End each section with one action for next time.
- Finish with a table of actions: action, expected effect, owner.
- Use simple English and short sentences.
RULES
- Use only numbers from my data. Never invent a number.
- Count only confirmed registrations, and use the same group for every rate.
- Count unique people, not scans. Keep event check-in, workshop enrollment, workshop check-in and checkpoint check-in separate.
- Ticket revenue = accepted ticket payments minus refunds, in [currency], up to [cutoff date]. Exclude pending and failed payments. Do not add invoice charges to payments. Say if taxes are included.
- Total revenue = ticket revenue + sponsor income + other income received, on the same basis. If income records are missing, ask me before you calculate profit or margin.
- Use [time zone] for all times.
- If you are not sure of a cause, write “possible cause”.
- Write “checked in”, not “arrived”: check-in times show when people were scanned, not when they arrived.
- Label estimates as estimates.
- At the end, list every number you calculated with its formula.
Save the prompt in a Project in Claude or ChatGPT, or in a shared document, and reuse it after every event. For the next event, update every field in brackets, including the event name and the event page, and attach the new files.
How does it work with an event management software?
Your event management software holds the registrations, payments and check-ins. When it is connected to your AI assistant, usually through an MCP server (a secure link between software and an AI assistant), the assistant reads that data directly and you skip most exports.
Before you start, check 3 things: which data the connection covers, which data you still need to export, and what permissions the assistant gets.
Why has event data always been hard to compile?
In our conversations with event teams, the hard part of a post-event report is rarely the writing. It is the data. Three problems come up again and again:
- The data sits in several exports. Registration answers are in one file, workshop choices in another, check-ins in a third. To get one row per attendee, someone joins the files in Excel. One team told us that two missing fields meant fixing 400 rows by hand before they could start their statistics.
- “Attended” does not mean the same thing everywhere. One team counted more than 650 people in the room, while the system showed 537 check-ins. Some badges had been printed on site without a scan.
- Each reader needs a different cut. Your director wants the summary. Workshop leads want their own attendee list. Finance wants ticket sales matched with the payments received, sometimes by location.
An MCP connection solves most of the first and third problems. The assistant reads registrations, workshop choices, check-ins and payments from the same source and joins them for you. You ask in plain words:
Build one table for [event name], with one row per confirmed attendee: registration answers, workshops enrolled, workshop check-ins, event check-in time and payment status.
Then prepare 3 versions: a summary for [my director], one attendee list per workshop for the workshop leads, and ticket sales by [pass type or location] for finance.
The second problem starts on site. AI can flag a gap between badges and check-ins, but only your team knows how many people came in. The check in Step 2 helps you catch it before it reaches the report.
Your assistant can also connect to more than your event software. If it has access to your CRM or your finance tools, it can add what event data alone does not show: which attendees have an open deal, or whether ticket sales match what your payment provider received.
Example: How does it work with Eventtia?
Eventtia keeps registrations, payments and check-ins in one attendee record, and the Eventtia MCP server connects that record to your AI assistant. Here is how the assistant gets each type of data:
| Data for the report | How the AI gets it |
|---|---|
| Registrations, attendee types, registration dates, payment status | Directly, through the Eventtia MCP server |
| Check-in status and check-in time for each attendee | Directly, through the Eventtia MCP server |
| Workshop enrollment and workshop check-ins | Directly, through the Eventtia MCP server |
| Check-ins at other checkpoints (sessions, cocktail) | Directly, through the Eventtia MCP server |
| Payments for each attendee | Directly, through the Eventtia MCP server |
| Survey results | Export from the Eventtia dashboard |
| Budget and costs | Your own files |
A few practical points:
- Setup takes under 5 minutes. Eventtia is listed in Claude’s connectors library and in ChatGPT’s plugin directory. Microsoft Copilot and other assistants that support MCP connect with the server address.
- The assistant uses your permissions. It sees only what your Eventtia role allows.
- Eventtia does not use your data to train AI models. Your AI provider has its own data policy. Check it too.
- Large events take longer. The assistant reads records page by page. For events with thousands of attendees, an Excel export from the dashboard can be faster.
- It is included in every Eventtia plan. There is no add-on fee.
Real-life example: How does Delabie measure its events?
Delabie, a French manufacturer of water controls and sanitary ware, runs about 10 client events per month in 8 European countries. That adds up to 150 events and 9,400 attendees on Eventtia.
Before Eventtia, its sales teams sent paper invitations and had no single place to track replies. Today, acceptance rates and attendance rates come straight from the invitations and the check-in app. Delabie can measure what each event delivers, in 5 languages, from the same templates. Read the Delabie case study.
What should you check before sending an AI-written report?
Check every number against its source, every cause against the data, and every promise against reality. AI writes fast, but it can make confident mistakes.
- Numbers: recalculate the 5 most important numbers yourself, such as attendance rate, profit and ROI.
- Titles: make sure each title is true. A strong title that is wrong does more damage than a weak one.
- Causes: check that the report does not present a guess as a fact.
- Savings: check that each estimated saving matches the action it comes from.
- Personal data: remove names and emails that the reader does not need.
- Tone: make sure problems are stated clearly. A report that hides difficulties is useless for the next edition.
Why ask a second AI to check your report?
When we built the Future World Forum example with Claude, we asked ChatGPT to challenge the first version. It caught mistakes that read well but were wrong: a goal marked as met when it was missed, and a saving that counted all the unused catering instead of what the proposed action would really save.
AI writes confident sentences, and an error in a confident sentence is easy to miss. A second AI that did not write the report reads it with fresh eyes. Give it the report and the data, and ask:
Challenge this report. Check every number against the data, and every title and conclusion against the numbers. List what is wrong or not supported, and explain why.
Then check its corrections yourself. It takes a few minutes and protects your credibility.
Frequently asked questions: How to write a post-event report
Can AI write a post-event report?
Yes. AI can check your data, calculate your metrics, find patterns, summarize feedback and draft the full report. You still need to check the numbers and decide the actions.
Which AI assistant is best for a post-event report?
Use the one your company already uses. How the assistant reads your data matters more than which assistant you choose.
What data do you need?
You need registrations, check-ins, payments, survey results, your goals and your costs. If your event software is connected to AI, the assistant can read the first three directly. You add the rest.
Is it safe to share attendee data with AI?
Use your company’s approved AI plan, and remove personal data the report does not need. With the Eventtia MCP server, the assistant only sees what your role allows, and Eventtia does not use your data to train AI models. Check your AI provider’s own data policy too.
What can’t AI do in a post-event report?
AI cannot know what happened on site unless you tell it, and it cannot verify numbers it was not given. It also cannot weigh the budget, supplier and team constraints behind your decisions. Those parts stay with you.
Should a post-event report be a document or a slide deck?
Use slides for a meeting with your director, and a document for finance, sponsors and your archive. The content is the same. With AI, you can produce both from the same analysis.
When should you send a post-event report?
Send it 2 to 3 weeks after the event, once the survey is closed and the supplier invoices have arrived. The Future World Forum example took place on September 14, and the report is dated October 5.
Can you reuse the same prompt for every event?
Yes. Keep the master prompt, update every field in brackets (event name, date, passes, program, goals and event page), and attach the new event’s files. Reusing the same prompt also makes your reports easier to compare from one edition to the next.
Keep reading
Eventtia is the platform behind the brands setting the standard.
Talk to us about how the platform fits into your stack: registration, communications, on-site and analytics, exposed deeply enough to compose.